Q2 2022 Investment Commentary

Investment Commentary Q2 – 2022
The Double Whammy – It’s Official

Q2 2022 – Commentary
It’s official, the US economy is in recession, having posted two consecutive quarters of negative GDP growth. The markets are up and it seems like hope is driving the bounce in equities. Hope is not a valid investing strategy.
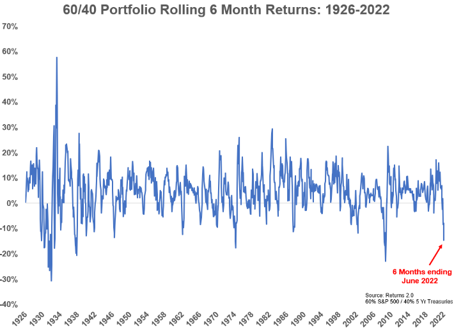
In my 50 years in the investment industry, I can’t recall a time when stocks and bonds went down together as much as they have in the first six months of this year in 2022. Even Gold was down 7% in the second quarter and did not provide a hedge against inflation nor the bear market in equities.
There really was no place to hide other than in commodities, especially oil and gas. This reinforces our philosophy that most of our clients’ money be in non-traditional/alternative asset classes, using absolute return strategies that are uncorrelated to the riskiest asset class, equities.
My mentor, Sir John Templeton, taught me to be a contrarian which simply means do not follow the herd and be different. Buy when there is panic selling and sell when there is panic buying or a fear of missing out. He also taught me that the best investments are made at the height of pessimism. We haven’t seen capitulation yet, where you would find people stating, “I will never own another stock again”.
As panic sellers flee for the exits, volumes will increase dramatically and that is the best time to buy. We believe it is prudent to be patient and because nobody can predict when the bottom will come, we will be adding very small amounts of equities opportunistically over time.
This past January we wrote in our investment commentary (2021 A Year in Review) quoting Charles Dickens from A Tale of Two Cities “It was the best of times, it was the worst of times.” We may not have seen the worst of it yet.
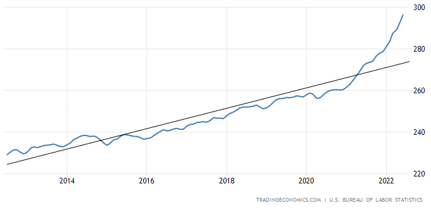
We’ve lost confidence in the Fed and the Bank of Canada to do the right thing. They overstimulated too much for too long in keeping interest rates at zero and having negative real rates, which occurs when inflation is taken into account.
They were either wearing blinders or had their eyes closed as to how high inflation would get and how high they would have to raise interest rates to tame the worst we’ve seen in 40 years.
US Consumer Price Index vs. Trend
To use the baseball analogy, we are not even in the middle innings yet. Because there are so many unknowns, which do not occur in a bull market, we continue to provide shelter in the storm by being significantly underweight in equities and in our debt strategies, we are either very short duration or floating rate exposure.
Because we do not know how high interest rates will have to go and for how long, and because we don’t know when inflation will start to come down and to what level, and because we don’t know when the war in Ukraine will end, and because we don’t know when supply chain issues will be resolved, and because we don’t know how China will react to United States and their latest embracing of Taiwan, and because we don’t know when oil prices will go down, and because we don’t know the future of Covid or the now new monkey pox, we continue to build our all-weather portfolios to manage drawdowns in the market. We intend to take advantage of opportunities in this bear market and recession to weather this storm.
We may be experiencing a hurricane now, but my greatest concern is if this turns into a tsunami. Because of our asset allocation model, which is mostly non-traditional, we have managed to preserve capital through these volatile times.
As you can see from the accompanying charts we are not out of the woods yet.
Q2 2022 – The Markets
The second quarter saw a continuation of the trends set early in the year. If investors in traditional asset classes were hoping for some respite from the drawdowns of the first quarter they were sorely disappointed as both equities and bonds accelerated their declines.
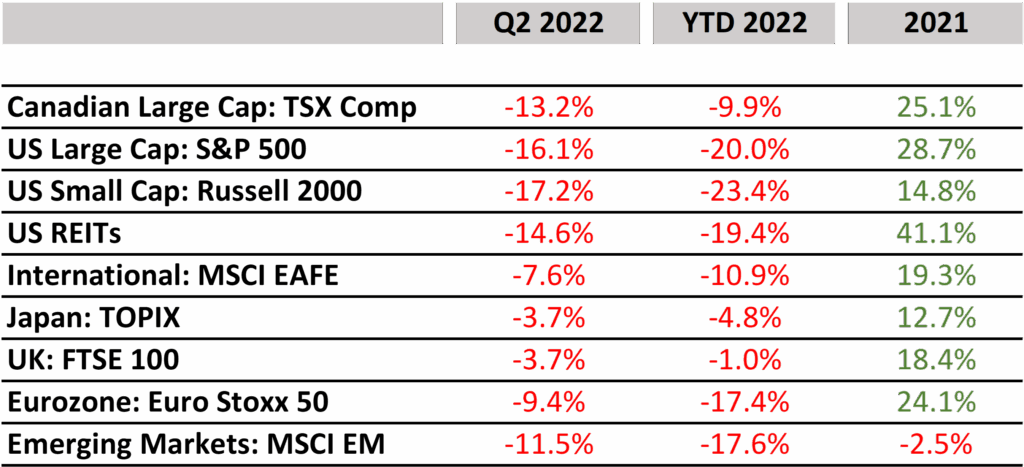
US equity performance was driven by hot inflation prints and the corresponding Fed policy response of raising rates. The S&P 500 index returned -16.1% in Q2 (-20% YTD). Canadian stocks shared a similar fate with the TSX Composite Index down -13.2% in Q2 (-9.9% YTD). The Canadian market’s higher exposure to the energy sector was the main factor in its smaller drawdown. While high oil prices have buoyed Canada in the near term it does leave some embedded risk if and when those prices come back down.
Developed international stock markets continued to struggle through June. The MSCI EAFE Index which tracks this basket of countries was down -7.6% in Q2 (-10.9% YTD). The Eurozone dealt with not only global inflation and growth concerns but also the continued geopolitical turmoil of the ongoing war in Ukraine. Russia constraining energy shipments to the EU has led to meaningful cost increases at an inopportune time. A peaceful resolution would benefit European markets but that seems unlikely as of this writing.
The emerging markets, being a diverse combination of countries, were a mixed bag as usual. Representing these markets the MSCI EM Index was down -11.5% in Q2 (-17.6% YTD).
On top of the ever present global economic growth concerns segments of the emerging markets had their own unique return drivers. Weakness in industrial metal prices (a key export) hurt Latin American markets while Poland and Hungary struggled with humanitarian crises due to their proximity to the Ukraine conflict. Interestingly, China was positive for the quarter, up +3.5% in Q2 (-11.2% year to date). Previous strict COVID lockdowns had been a headwind but the easing of those policies in June has brought some positive sentiment back to the Chinese market.
Regardless of the geography it is important to remember that investing in stocks is not just about the quality of the underlying companies, but also what valuation the market is placing on those firms. At the end of a bull market even great companies may be significantly overvalued.
Q2 2022 – Interest Rates and Inflation
Global bonds continued to sell off in the second quarter driven by stubborn inflation and hawkish monetary policy. Central banks have been and are continuing to attempt a very difficult proposition – taming inflation while simultaneously trying to avoid a recession.
On the latter goal the Fed has failed as the US has officially entered a recession as of the latest GDP report. However, it is not a binary win/loss and central banks will still be trying to minimize the severity of negative growth moving forward, to the extent that they can.
Years of low rates and money printing, exacerbated by the more recent supply chain issues has brought us to the current situation of inflation at multi-decade highs.
US Y/Y Inflation Rate
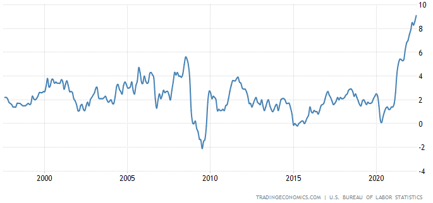
Canada and the EU have seen similar increases with inflation reaching 8.1% and 8.6% year over year respectively through June. The messaging from central banks has been clear that their primary goal is to bring inflation under control and they have followed up with interest rate hikes. As of this writing the Fed has raised rates to 2.5% (up 2% from Q1), The Bank of Canada has also raised rates to 2.5% (up 2% from Q1) and even the perpetually low-rate ECB has raised to 0.5% (up 0.5% from Q1).
The ten-year treasury yield ended June at 2.98% (up 0.66% from Q1) which appears to be pricing in the widely expected rate increases. Future moves will be driven not by official announcements but rather by investors forward looking expectations of Fed action.
These rate increases have caused pain for investors as higher rates result in declining bond prices. The Bloomberg Global Aggregate Bond index was down -8.3% in Q2 (-12.4% YTD). Higher rates also act to slow growth and increase recession risks, negatively impacting stocks.
So when is the pain likely to stop? Nobody knows for sure but one inflection point we will be watching very closely is when the inflation trend changes (multiple prints of stabilized or declining inflation). This would give central banks the flexibility to pause rate increases or even lower rates which would finally give markets room to breath.
Q2 – 2022 – Charts
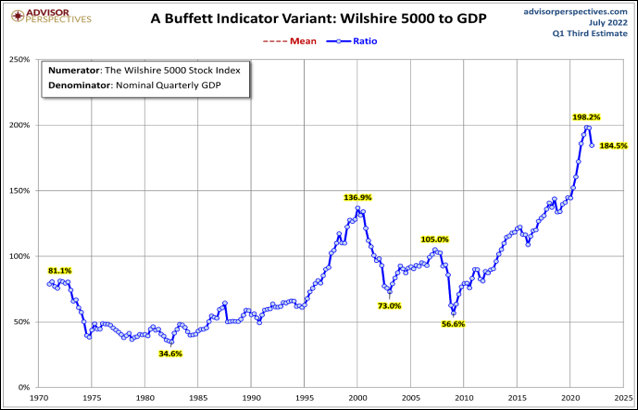
- The Wilshire 5000 Index, which is a broad-based stock index, divided by the GDP illustrates how risky the market still is relative to the last 50 years
- This indicator of market valuation measures the market capitalization of public equities relative to Gross Domestic Product in the United States.
- When public market valuations are high relative to GDP (100%+), as they are now, that is an indication that markets are overvalued.
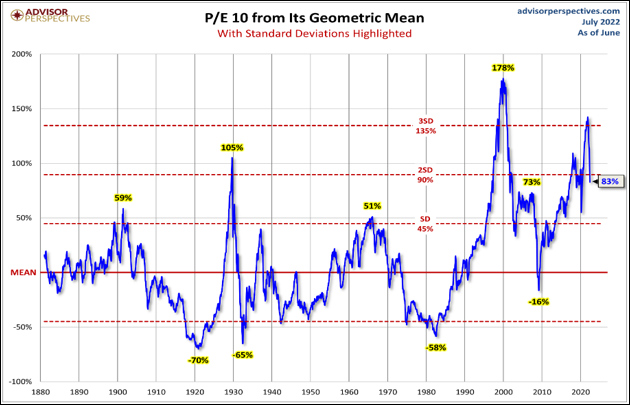
- The P/E 10 ratio divides the price of the S&P500 by a 10-year average of inflation-adjusted earnings, effectively smoothing out fluctuations in the business cycle.
- This 140-year graph showing the Price Earnings (P/E) Ratio with risk being highlighted, shows that the market is still priced rather expensively.
- When the ratio exceeds 2 standard deviations above the mean, bear markets have historically followed. As the metric recently breached the 3 standard deviation from the mean level, it is no surprise that we have seen a bear market in US equities through the first half of the year.
Chart 1: Ten Year U.S. Treasury Yield (%)
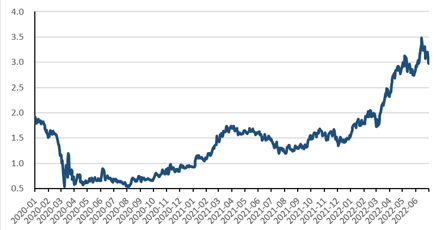
Table 1: Commodities (USD)
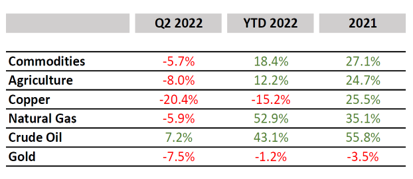
Chart 2: Cdn & U.S. Bond Market Performance
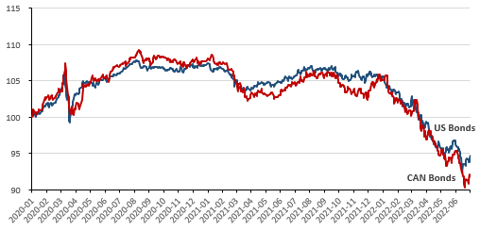
Table 2: Summary of Global Equity Returns
Download a copy of this article in pdf here.
Insights
View AllNews & Events

News & Events
Keep up to date on Our Family Office's latest firm news, events, global and regional awards, as well as the latest announcements.
Tim Cestnick’s Globe & Mail Articles

Tim Cestnick's Globe & Mail Articles
Catch up on our Co-Founder and CEO, Tim Cestnick's weekly column. His status as an expert is reinforced by his role as a tax and personal finance columnist for The Globe and Mail, Canada’s most prominent national newspaper.
Investment Thinking

Investment Management
We provide tax-efficient preservation and growth of your investment assets, utilizing best-in-class global strategies, strategic asset allocation, rigorous due diligence on managers and their selection.
Podcasts

Podcasts
Our Family Office proudly presents the Our Family Office Podcast. Throughout the inaugural season, host Adam Fisch speaks to various experts from across our firm, offering insights into the areas of focus for an integrated family office, and the ways that a Shared Family Office™ can help Canada’s wealthiest families.