Investment Commentary Q3 – 2024 Stocks Up, Rates Down, Now What?

Q3 2024 – Commentary
We are not soothsayers. We do not have a crystal ball nor do we prognosticate.
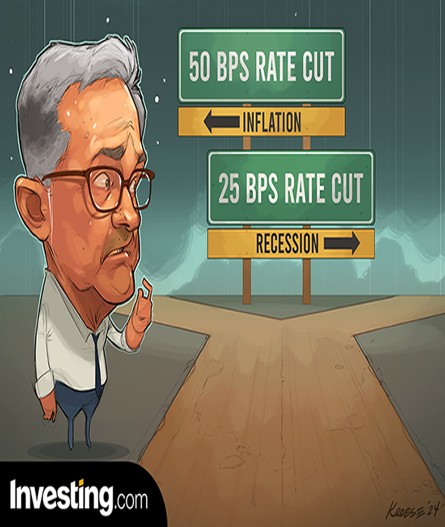
Last year at this time, most economists around the world were predicting that the Federal Reserve would cut interest rates four or five times in 2024. Well, we’ve had one cut so far and maybe we’ll have a second. Because interest rates were so low for so long, we believe that interest rates will stay higher for longer. Not only because the pendulum swings too far in both directions, but because the Federal Reserve’s fear of a return to dangerous inflation levels has been underestimated.
Recent economic data that’s come out shows that the US economy is stronger than many predicted given the high interest rates, and the last thing the federal reserve wants is to have to raise interest rates again. If they don’t beat inflation this time around it will be devastating for the US economy and will have implications for many countries around the world, most importantly Canada, where we could see our Canadian dollar fall dramatically. The current debate that has been taking place with economists is a US soft landing versus hard landing, or what I’m referring to, which is no landing at all.
Last year at this time, the title of third-quarter 2023 commentary was “Is Cash The King Now”. Cash is no longer the King, but it’s still a Jack. Short term rates have come down in Canada ¾ of one percent. As of this writing rates are down another ½ percent. Its possible that as Canadian rates continue to come down in the future cash might be a Joker.
As rates on cash come down we have found other strategies that will make up for that income with a similar amount of risk. The short-term bond market still looks very appealing, with attractive yield to maturity as well as the potential to capture capital gains. The short-term mortgage market, assuming you do the proper diligence to find the right fund manager, will provide you with an excellent risk adjusted return over the next couple of years. These strategies will offer an increasingly attractive spread over cash. It’s not the time to shift cash allocations into risky assets like stocks, but we believe now is certainly the right time to be moving into the areas mentioned above that still offer high single digit returns for minimal risk.
I could argue that the risks today are greater than they were a year ago. The human tragedy and devastation of October 7th had not happened yet, and there was only one regional war at the end of the third-quarter last year. Now there are two. The Middle East is a powder keg and one has to focus on what the potential possibilities are for that region.
Another risk is that the stock market is not reasonably priced. It continues to trade at new highs almost every day and the valuation metrics are at record highs. The margin debt that people have taken on to push stocks higher is also at a record high, and we know that when they sell stocks to pay off that margin, markets go down. We have also shown this chart previously, which demonstrates that the market goes down when interest rates go down. And then there is the US election. Anyone want to guess the outcome?
Fed Funds Rate Cuts and S&P 500 Drawdowns
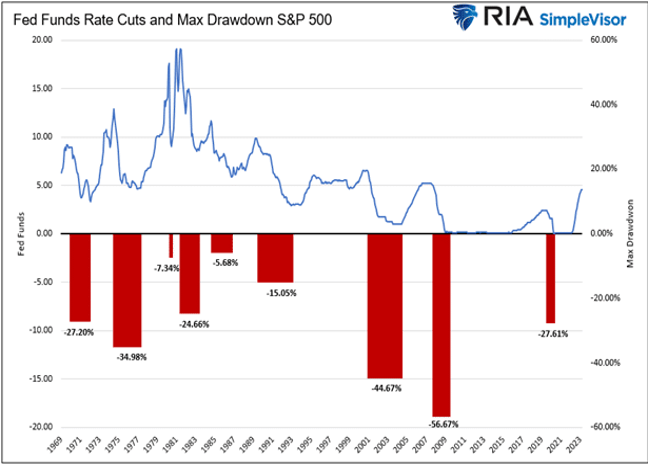
The yield curve, which had been inverted since mid 2022 finally returned to a more normal state at the end of the quarter. The inverted curve is an unusual phenomenon when bonds with shorter maturity provide a higher yield than longer term bonds. Last month the yield curve un-inverted for the first time in 26 months, marking the end of the longest yield curve inversion on record. While inverted yield curves have historically been a predictor of recessions it is important to note that the recent normalizing of the yield curve is not necessarily an all-clear sign. The recessions forecast by yield curve inversions often don’t start until after the inversion is unwound, meaning now is a time to remain vigilant with regards to risk in portfolios.
We tend to take a conservative approach to everything that we do focusing on risk more than returns. My mentor and friend Sir John Templeton taught me that it’s not how much you make, it’s all about not losing. That’s why we focus on asset classes, the historic value of those asset classes and how much risk you take for the return that each provides. Once we find an asset class with the characteristics we believe will enhance portfolios, we then seek out a manager who is amongst the best in that area. Often these are managers that are specialized rather than a jack of all trades and very frequently these are small to medium sized funds as opposed to giant mega-funds where charging fees on assets is their primary motivation rather than performance. So far, this methodology is working extremely well and we continue to follow this philosophy in our daily search for new and exciting asset classes and managers.
Q3 2024 – The Markets
The third quarter of 2024 was a tumultuous period for US markets, with the S&P 500 posting both its biggest one-day slump and best rebound since 2022.
A combination of weak US economic data, an unexpected interest rate hike from the Bank of Japan and thin summer liquidity saw stocks hit particularly hard in early August. The rate hiking decision by Bank of Japan unraveled the Japanese yen’s carry trade, where investors borrow yen at low rates and invest in higher-yielding currencies like the U.S. dollar. As the yen surged, traders scrambled to exit their positions, causing a rapid selloff that rippled through global markets. However, the long-anticipated start of the Federal Reserve’s rate cutting cycle in September, along with a less hawkish tone from Japanese policymakers and new stimulus in China, helped to soothe investor concerns and support a rally in stocks into quarter end.
The S&P 500 returned 5.9% (in USD term) over the quarter. There were signs of “broadening out” of returns finally starting to play out. Notably, the equal-weighted S&P 500, which removes the imbalance of the heavily weighted mega-cap tech stocks, returned 9.1%, outperformed the market-cap weighted index, signaling a broadening of the rally.
A number of disappointing earnings results cast doubt on big-tech company valuations. In fact, only three of the “Magnificent 7” beat the Index return, while the other four were in negative territory for the quarter.
The small-cap Russell 2000 index, returning 8.9%, outperformed its larger peers, after trailing for the prior year and a half. Technology was one of the weaker sectors along with energy, while interest-rate sensitive pockets of the market such as utilities and real estate led the way. US value stocks outperformed their growthier counterparts by 7% overall.
Emerging market (EM) equities delivered strong gains in Q3, with MSCI EM index returning 8.7% (in USD terms), outperforming developed markets. It was a volatile start to the quarter, when technology-related stocks sold off sharply. Subsequently, however, China posted double-digit returns against a backdrop of monetary stimulus measures announced in September.
Q3 2024 marked a meaningful regime change, as the U.S. Federal Reserve cut interest rates, thus bringing an end to their interest rate tightening cycle which began in March 2022. On September 18, the Fed decided to drop the Federal Funds Rate by half a percentage point to a range of 4.75%–5%.
After reaching a peak target Fed Funds rate of 5.33% in August 2023, the market had originally expected the Fed to begin cutting rates around March of this year. While the Fed repeatedly stated that they needed to see more tangible evidence of inflation cooling, the wait was longer than many expected. Nonetheless, the reduction represents a significant turning point for the Fed as it tries to fulfill its dual mandate of stable prices and full employment.
With inflation cooling, other western central banks also deemed it appropriate to cut rates. The European Central Bank delivered its second rate cut of 25 bps in September taking interest rates to 3.5%, while the Bank of England embarked on its own easing cycle with a 25 bp cut at its August meeting. Bank of Canada continued to cut rates in response to a steady decline in inflation, as well as higher unemployment. With the U.S. Fed joining central banks from Europe, Canada, China and Australia amongst others in rate cutting, the cycles are now reasonably synchronized across the globe.
In the bond market, US Treasury yields fell substantially over the quarter with 2-year yields leading the way, falling 111 bps, as the yield curve steepened to reflect the outlook for lower interest rate policy. The shift in investors’ expectations for interest rates helped government bonds to perform strongly. US Treasuries returned 4.7%, while European sovereigns returned 4.0% over the quarter.
Many investors are naturally left wondering how much more upside in stocks remains now that the interest rate cuts have finally begun. It is important to note that the S&P 500’s returns in the months and the year following the first rate cut can vary quite widely. Rate cuts that coincided with recessions also coincided with weak near-term stock market performance. What determines stocks’ short-term outcome after the first rate cut is heavily dependent on the state of the economy.
Q3 – 2024 – Charts
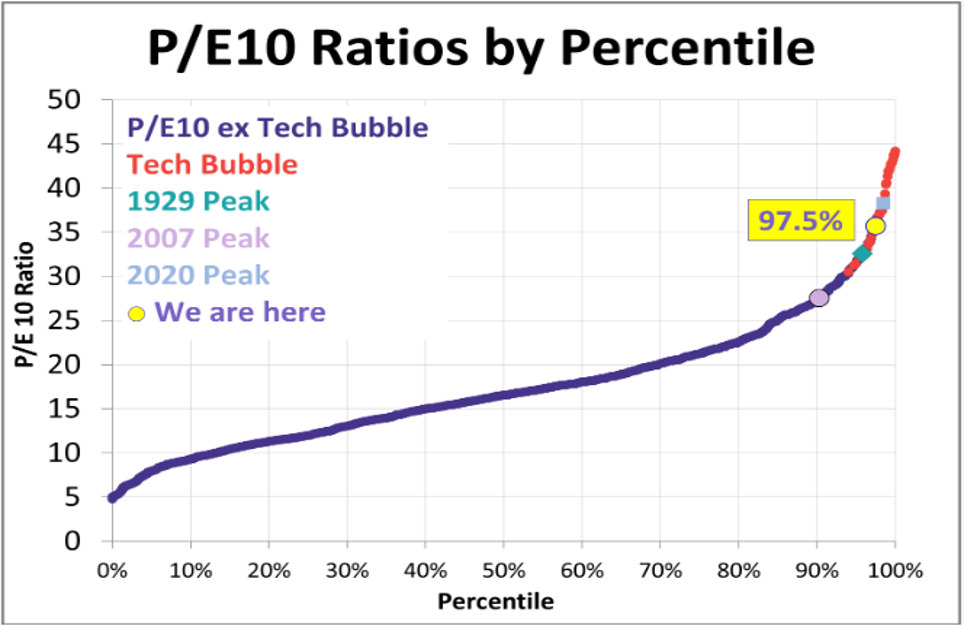
- The P/E 10 Ratio was developed by Benjamin Graham and David Dodd to devise a more accurate way to look at market valuation.
- P/E 10 looks at the 10 year average of earnings relative to the current price of the index, which smooths out temporary extreme valuation fluctuations.
- The above chart shows that the current P/E 10 valuation of the S&P 500 sits at the 97.5% percentile.
- This level of valuation is very high historically, higher than 1929 and 2007 and in the same valuation range as the Tech Bubble.
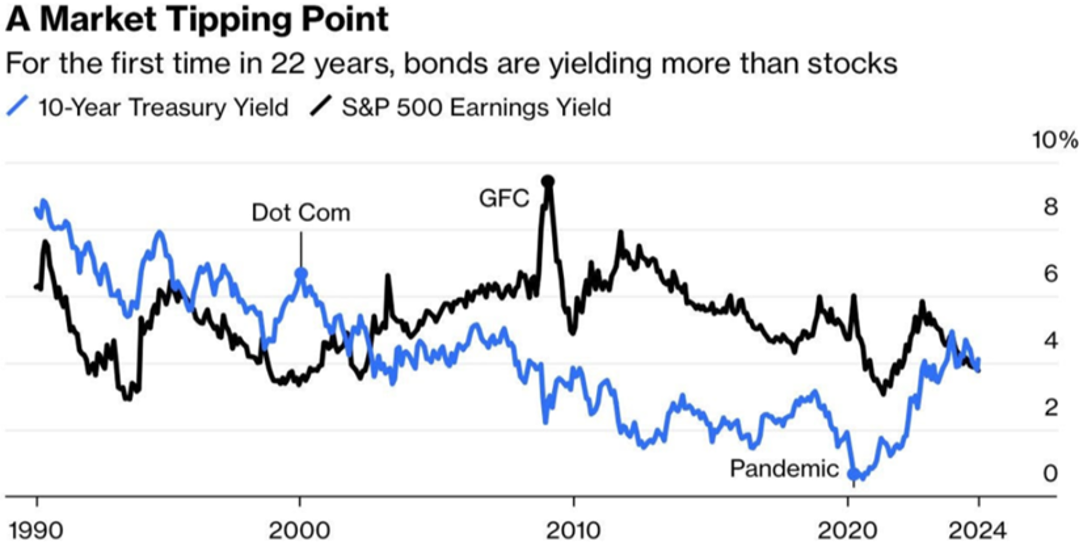
- The above chart shows the yield on 10-year treasury bonds and the earnings yield on the S&P 500 over the past 34 years.
- The S&P 500 earnings yield is the earnings of the S&P 500 divided by current price of the index.
- The S&P 500 earnings yield can be compared with the 10-year treasury yield to understand the relative valuation of the stock market compared to bonds at a point in time.
- When the earnings yield on stocks is less than the yield on bonds (as it is now) stocks may be considered overvalued.
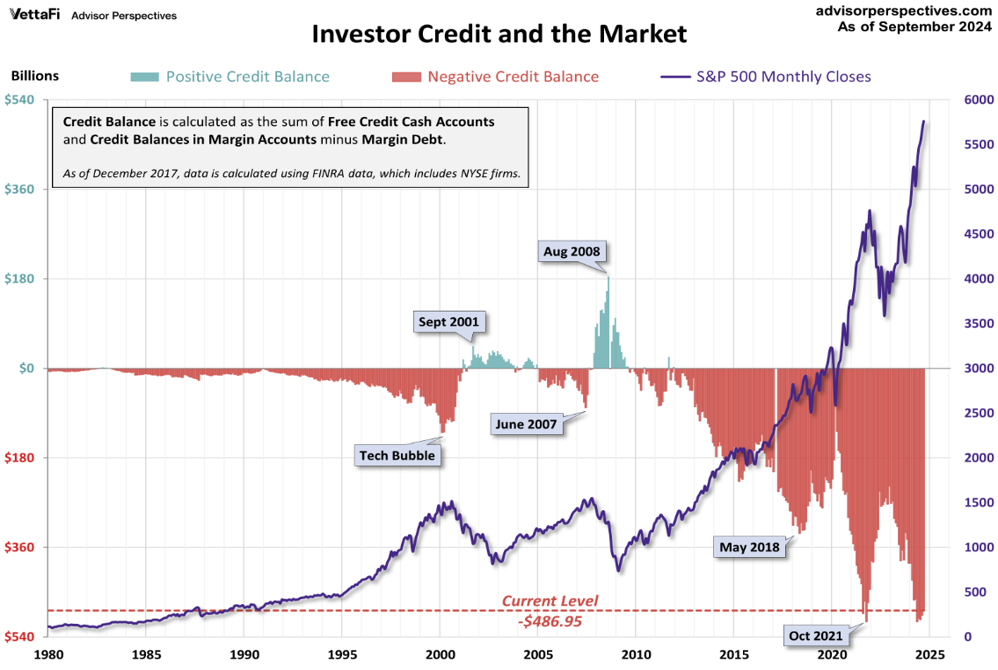
- Investor credit balances and margin debt overlayed with S&P 500 performance over the last 44 years. Investors have historically negative credit balances with the market continuing to make new highs.
- As markets fall, there is widespread selling of securities causing margin balances to turn positive since investors are required by their brokers to reduce their debt balances, often more than mitigating it.
- Preceding major recessions such as the Tech Bubble (2000) and the Financial Crisis (2007-2008), margin levels tend to peak with the market – making it a useful indicator to watch for future downturns.
- The indicator remains near the October 2021 low point, after which the S&P500 slipped into a bear market.
Download a copy of this article in pdf here.
Insights
View AllNews & Events

News & Events
Keep up to date on Our Family Office's latest firm news, events, global and regional awards, as well as the latest announcements.
Tim Cestnick’s Globe & Mail Articles

Tim Cestnick's Globe & Mail Articles
Catch up on our Co-Founder and CEO, Tim Cestnick's weekly column. His status as an expert is reinforced by his role as a tax and personal finance columnist for The Globe and Mail, Canada’s most prominent national newspaper.
Investment Thinking

Investment Management
We provide tax-efficient preservation and growth of your investment assets, utilizing best-in-class global strategies, strategic asset allocation, rigorous due diligence on managers and their selection.
Podcasts

Podcasts
Our Family Office proudly presents the Our Family Office Podcast. Throughout the inaugural season, host Adam Fisch speaks to various experts from across our firm, offering insights into the areas of focus for an integrated family office, and the ways that a Shared Family Office™ can help Canada’s wealthiest families.