Investment Commentary – Q2 2025 Are The Markets Too Complacent?

Q2 2025 – Commentary
The stock market today is at a record high and yet there are more unknowns today than I can ever remember. Tariffs, such that the world has not had to worry about in many decades are now top of mind of every American and in those countries where tariffs will be put on or increased.
The two major questions to ask are…Will Trump continue to delay the implementation of tariffs on countries around the world, or will he go ahead and make tariffs the new international law and something that we will all have to get used to? The American consumer is concerned that if there are tariffs, then inflation is the next step. Perhaps it is time to buckle up. Accidents cannot be predicted nor can market corrections. If the tariffs go through, will that create greater inflation? Many people, including Jerome Powell at the Fed are very concerned about that possibility. Trump recently made trade deals with Japan and the European Union at 15% tariff rates and negotiations continue with several other major trading partners, with potential tariffs of greater than 25% on the table. The five largest exporters to the United States, which include Canada, the European Union, Japan, Mexico, South Korea, but not including China, account for more than 55% of US imports.
As far back as 1987 Donald Trump as a businessman, not a politician, has been consistent in his view towards tariffs as a tool in US trade policy, with the aim of reducing US trade deficits and opening up foreign markets to more US exports.


Another persistent risk is the debt; consumer debt, investment debt, and of course US government debt. This concern is not unique to the US as debt loads in Canada and many other developed nations are also significant.
In 2025 approximately $9.2 trillion of US debt will mature. That’s roughly 33% of the total market and 30% of US GDP, quite a significant event. In addition to the almost $2 trillion deficit US treasury issuance this year is expected to exceed $10 trillion. It’s no wonder why Trump is threatening to fire the Fed chair, Jerome Powell, as he would rather finance the country’s debt at lower interest rates. We continue to be concerned about the amount of debt in the system, which increases the supply of funds chasing risky assets such as stocks. One can easily ask themselves: who is going to pay off this debt? As individuals we try to be fiscally responsible. It doesn’t seem that governments, including Canada, really care that much and all they are doing is kicking the proverbial “can down the road”. Does the road end with our children or grandchildren?
We are keeping a very close eye on interest rates and the Fed’s actions. Even if the Fed cuts rates in the coming quarters that does not guarantee that longer term rates (such as 10-year or 30-year rates) will fall as these are driven by the supply and demand for bonds. As far as our asset allocation to fixed income, we continue to be tactical with high quality, very short duration and floating rate strategies.
As I stated, with markets at records highs, what creeps into an environment like this is FOMO, the fear of missing out. This FOMO is driving a resurgence in meme stock trading, with retail traders buying stocks on hype without regard to fundamentals. Manias, like we are currently seeing in meme stocks typically precede volatile swings that do not end well for those holding the bag. Stock ownership amongst Americans is also at a record high with 58% of households owning stocks, and equity ownership representing a record 29% of household financial assets. The bottom 50% of Americans, not surprisingly, only own 1% of all stock and mutual fund shares, but those investments represent retirement funds and financial cushions for those that need them most. If there was to be a correction in the market, the top 10% of Americans, who own 93% of the stock market, would hardly feel it. They might be upset, but it would definitely not change their lifestyle, and they can afford to invest for the long term and wait for downturns to end. It’s the other 90% of Americans, who only own 7% of the stock market, that I’m concerned about.
Here at Our Family Office, we focus on risk, risk of a drawdown and risk of loss in all the strategies that we invest in for our clients. There are so many asset classes out there, other than the stock market where we can get a much better risk adjusted return. There are many strategies that, for a fraction of the risk of the market, will give you an equal or even better return in our opinion.
Q2 2025 – The Markets
The second quarter of 2025 saw significant volatility across markets with US policy being a key driver of market uncertainty. The quarter began with President Donald Trump announcing a surprisingly aggressive tariff plan on April 2nd. Between April 2nd and April 8th, the S&P 500 dropped over 12%. That was the worst four trading-day drop since March 2020. On April 9th, Trump announced a “pause” on the most severe of the tariffs, resulting a 9% stock market rally in a single day, the largest one-day gain for the S&P 500 since the global financial crisis in October 2008. The rally continued in May and June, and by the end of the quarter, US stock markets, along with other major regional markets, were hitting new all-time highs.
S&P 500 index ended the quarter with a gain of 10.9% (in U.S. dollar term). The biggest story was the rally in the technology sector, which returned 21.95% after falling more than 12% in the first quarter. Communication services stocks gained 18.79% after falling 6.19% in the first quarter, while industrials rallied 13.08% after a 3.21% loss in the first quarter.
As U.S. markets surged to close out the second quarter, other major markets also reached record highs. S&P/TSX index gained 8.5% over the quarter, led by commodities. MSCI EAFE (Europe, Asia, Far East) index gained 4.8% (in local currency). Easing trade tensions between the US and China and a falling dollar boosted emerging market equities with the MSCI Emerging Markets Index gaining 7.9% (in local currency).
The war between Iran and Israel caused significant geopolitical volatility, but its impact on markets was muted. The announcement of increased OPEC production dragged on oil prices. Despite some short-term volatility prior to the US intervention on June 22nd, which temporarily pushed Brent Crude to an intra-day high of $80 a barrel, oil prices ultimately ended the quarter back down at $68 a barrel, resulting an 8.9% decline over the quarter.
While US stocks recovered from April’s volatility, the US dollar saw continued weakness, with the DXY dollar index ending the quarter down 7.1%.
Most of the bond market remained positive over the quarter, despite elevated volatility. The yield curve steepened with long-term yields rising higher as bond investors digested fresh concerns about the federal deficit, a declining global appetite for US dollar-denominated debt, and the implications of the “One Big Beautiful Bill Act”.
A steeper curve means investors are demanding higher yields for longer-dated bonds. Yields on the U.S. 10-year Treasury note ended the quarter at 4.23% after climbing as high as 4.58% in May. Yields on the 30-year Treasury note soared above 5.00% in May before falling back to 4.79%. Yields move in the opposite direction of bond prices.
The Federal Reserve held rates steady at the conclusion of its meetings on May 7th and June 18th. Federal Reserve Chair Jerome Powell said he expects “meaningful” inflation ahead as consumers pay more for goods due to the Trump administration’s planned tariffs. In the new economic projections released alongside the Fed’s statement, policymakers sketched a modestly stag-flationary picture of the economy, with growth in 2025 slowing to 1.4%, unemployment rising to 4.5%, and inflation ending the year at 3%.
On May 16th , Moody’s (one of the three main credit rating agencies) downgraded the US from its highest AAA grade to Aa1, citing “large annual deficits and growing interest costs.” The decision “reflects the increase over more than a decade in government debt and interest payment ratios to levels that are significantly higher than similarly rated sovereigns,” Moody’s said in a statement announcing the rating downgrade. “We do not believe that material multi-year reductions in mandatory spending and deficits will result from current fiscal proposals under consideration.”
The move follows earlier cuts from S&P in 2011 and Fitch in 2023, driven by rising debt concerns and political gridlock. Now, for the first time since 1917, the US no longer holds top-tier ratings from any of the major agencies — trailing the 11 countries that still boast the highest grading from all three, including Australia, Denmark, Germany, and Canada.
On July 3rd the U.S. Congress gave its final approval to the sprawling tax-and-spending bill. The resulting legislation will add $3.4 trillion to federal deficits through 2034, according to the Congressional Budget Office.
The Bank of Canada opted to hold interest rates unchanged on April 16th, June 4th and yet again today, pointing to high uncertainty about the economic outlook brought about by US trade war. This leaves the key overnight interest rate at 2.75%. The Bank of Canada estimates Canadian economy growth to have slowed to 1.8% in the first quarter of 2025 and growth in consumption to have slowed from 5.5% in the fourth quarter of 2024, to 1.5% in the first quarter of this year.
The quick rally of stock markets does raise some concerns given the range of risks facing the global economy in the second half of 2025. Amidst the policy uncertainty, we expect the full impact of tariffs to become more apparent as we move through the next 6-18 months, and it is unclear how all the facets of US policy will interact. Investors should look to build well diversified portfolios that are resilient to the wide range of risks ahead.
Q2 2025 – Charts

- The above chart shows the percentage of US households’ financial assets in the stock market.
- Previous times where this metric peaked were prior to the bear market of 1968 and prior to the Dot-Com crash in 2000.
- The current reading of 29% is higher than both previous peaks since 1945.
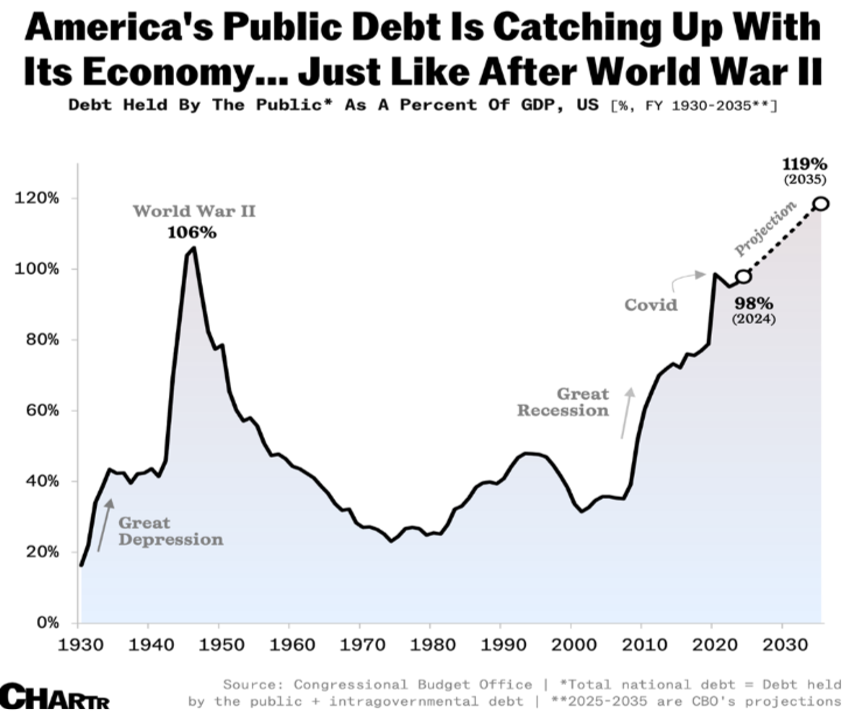
- The above chart shows the US public debt as a percentage of GDP, which is currently near the previous World War II high and projected to exceed that level in the near future.
- Growing government debt is a drag on economic growth and coupled with higher interest rates leads to an increasing amount of the annual budget being used to pay interest costs.
- Based on high debt and continued deficits Moody’s recently downgraded the credit rating of the US
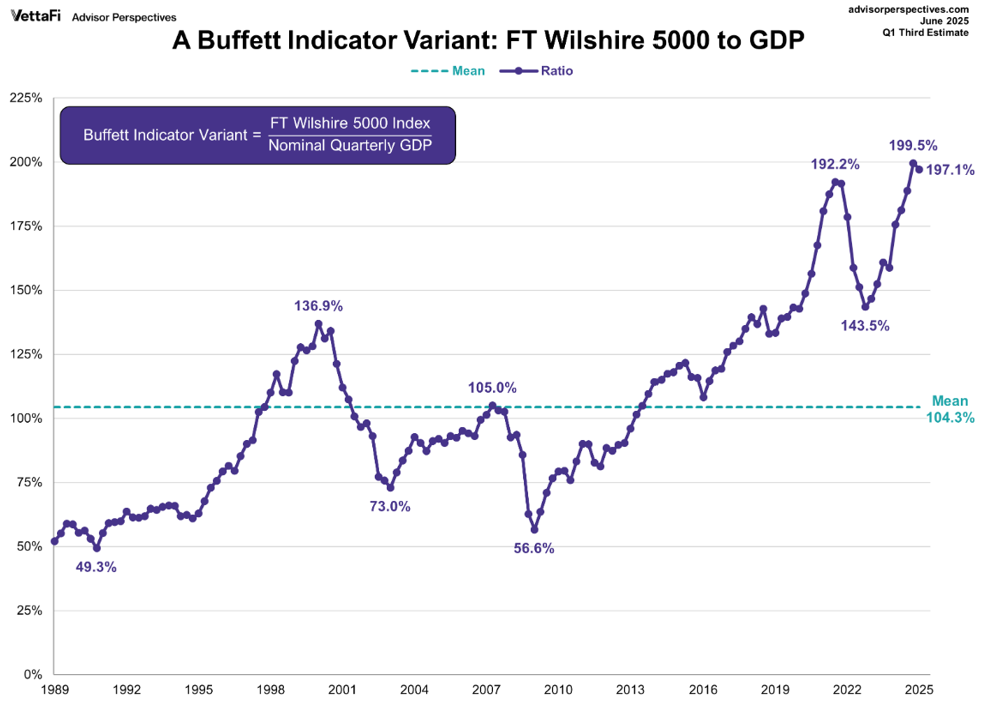
- The Wilshire 5000 Index, which is a broad-based stock index, divided by GDP illustrates stock valuations relative to the economy.
- When public market valuations are high relative to GDP (100%+), as they are now, that is an indication that markets may be overvalued.
- As of June 2025 the Buffet Indicator is near its highest peak at 197.1%
Download a copy of this article in pdf here.
Insights
View AllNews & Events

News & Events
Keep up to date on Our Family Office's latest firm news, events, global and regional awards, as well as the latest announcements.
Tim Cestnick’s Globe & Mail Articles

Tim Cestnick's Globe & Mail Articles
Catch up on our Co-Founder and CEO, Tim Cestnick's weekly column. His status as an expert is reinforced by his role as a tax and personal finance columnist for The Globe and Mail, Canada’s most prominent national newspaper.
Investment Thinking

Investment Management
We provide tax-efficient preservation and growth of your investment assets, utilizing best-in-class global strategies, strategic asset allocation, rigorous due diligence on managers and their selection.
Podcasts

Podcasts
Our Family Office proudly presents the Our Family Office Podcast. Throughout the inaugural season, host Adam Fisch speaks to various experts from across our firm, offering insights into the areas of focus for an integrated family office, and the ways that a Shared Family Office™ can help Canada’s wealthiest families.