Investment Commentary Q1 – 2023

Q1 2023 – Commentary
In writing this first quarter report, I’m spending extra time thinking about the world we live in.
March Madness normally refers to the men’s NCAA Basketball Tournament. There are four brackets and if you win your game you move on to the next round. There are 64 teams, 16 in each bracket and they are seeded. As the tournament progresses the teams play down to the Sweet 16, the Elite Eight (quarter finals) and the Final Four (semifinals). For the first time, since 1979 when they begin seeding, not one first seed in four different brackets made it to the Elite Eight. You could make the argument that this could’ve been a one in 100-year event.
The other March Madness, of course, was that 3 banks failed, and had to be bailed out. So much has been written about this that I will not spend real estate on this page re-examining why they failed or why they were rescued, however, the implications, in our opinion, have yet to be completely felt. There might be other shoes to drop. It is expected that lending standards will tighten as banks get more conservative in the wake of March’s banking issues, which will be a headwind for economic growth. Who would have predicted that in the same month, all four first seeds would have lost before the quarterfinals and three banks would have failed.
Another madness which is bothering me a lot is the proliferation of sports betting. Almost every commercial on TV when watching sports involves the new, exciting, gratifying and serotonin and dopamine creating commercials for online gambling. Most of you understand that betting is a losers’ game.
For those readers old enough to remember, in the 1950s when television was in its infancy, some of the most prominent commercials on TV were cigarette brands, promoting a socially appealing and glamorous lifestyle. The idea of promoting something that is not positive for your health, or your bank account and has proven to be habit forming and addictive is something that I think long and hard about. The comparison to sports betting today troubles me immensely, as it’s mostly young people who are doing it, and perhaps cannot afford to lose, just like most lottery ticket buyers.
Why I am bringing this up in our Quarterly Investment Commentary is to give context to the fact that one of the longest bull markets in history started some 14 years ago, when the Great Financial Crisis ended, and the new bull market began. Most investors under 45 years of age have never experienced a bear market or recession, other than the brief period at the beginning of COVID when the S&P 500 dropped 34% before a V shaped recovery of the market that lasted a matter of months. And why shouldn’t that happen again? Today’s cohort of investors, due to what they have experienced in their investing lives, believes that anything you buy will go up and the bull market bias, recency bias, and confirmation bias exhibited by this crowd is extremely worrisome, whether they are invested in meme stocks or growth stocks.
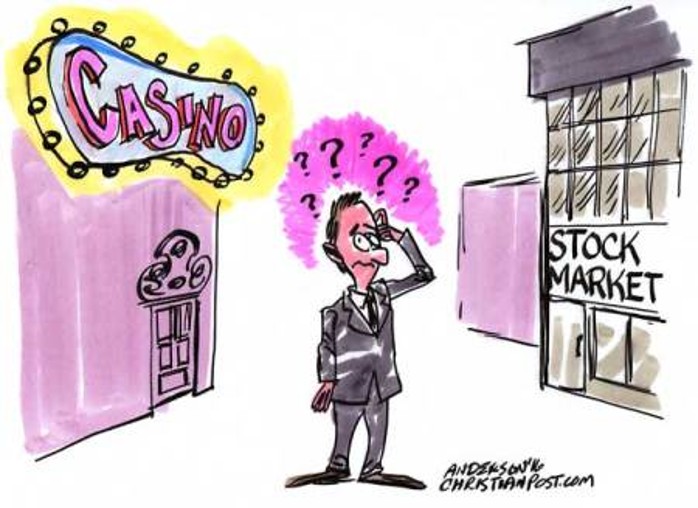
Working from home during COVID exacerbated what I like to call the new casino. This generation now sees hundreds of commercials on TV when watching sports events underscoring that gambling is not only okay, but it’s good for you, just like gambling in the stock market.
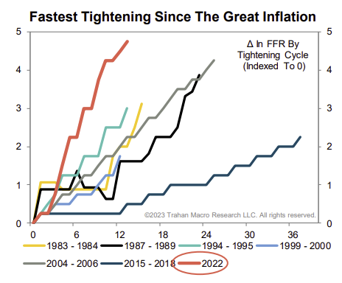
The market is holding up much better than most seasoned investors believe is sustainable. This skepticism is appropriate given the fastest, steepest and largest increase in interest rates in recent history.
The effects of this interest rate policy may not be felt for over a year. The ultra-low and declining interest rates in the past several decades are unlikely to continue in the next several years. The historic nature of these increases and the fact that the full impacts may not yet have been felt means one needs to be very cautious.
I was taught by my mentor, Sir John Templeton to buy when everyone sells and sell when everyone buys. Right now, we believe it’s too early to fill your hat with equities and are waiting for an opportunity. As a reformed portfolio manager picking stocks for 35 of my 50 years, I’m seeing things now that I’ve never seen before. We are waiting for capitulation and right now we are nowhere near it.
When I think about surprises, it’s hard for me to think of any positive surprises. I only think about what can go wrong. Perhaps that’s why we’ve positioned our client portfolios to be weighted towards non-traditional investments and as a result they were up last year while traditional markets saw steep declines. We also made a tactical decision over two years ago that any income strategies must be very short duration or floating rate debt.
I am worrying about all these new words in my vocabulary, that perhaps I didn’t think about, or even know decades ago. Words like politicization, polarization, and de-dollarization. I believe that geopolitical and global macro events will continue to be the most important influence on our asset allocation decisions.
Another worry that I have is that the government’s debt keeps increasing to new highs on a regular basis. To paraphrase Oaktree Capital’s Howard Marks, “It’s too good to be true to think that you have a credit card and never have to pay the balance off.”
We all know that there will be serious consequences down the line, and we like to think that there is light at the end of the tunnel, however, I hope it’s not a train coming.
You would think after reading this that I am a worrier. I’m actually not. I just think about these things so our clients don’t have to.
Q1 2023 – The Markets
After a brutal 2022, stocks and bonds posted gains during the first quarter despite considerable volatility. In this environment, a prudent portfolio focusing on mitigating volatility and risk proves to be beneficial to investors.
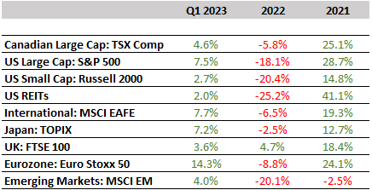
The S&P 500 returned a positive 7.5% over the quarter, and the MS World Index (USD) returned 7.7%. Gains came despite the collapse of Silicon Valley Bank, which caused significant volatility in bank shares. The performance in U.S. equity markets so far this year has been mostly driven by interest rate expectations, a theme that should persist as earnings expectations gradually align with reality.
Taking this a step further and decomposing performance into the underlying drivers helps us understand why – the majority of the return from growth stocks was driven by an increase in valuations, as interest rates declined on the back of expectations for a more dovish Fed later this year. Meanwhile, earnings expectations fell across the board. Earnings estimates are likely to continue their decline, particularly across the more cyclical sectors. This warrants a cautious approach to equity markets.
Eurozone shares notched up strong gains in Q1, with MS EAFE Index (USD) returning a positive 8.5% over the quarter, despite volatility in the banking sector. The European Central Bank raised interest rates by 50 basis points in both February and March. Eurozone inflation declined to a one-year low in March.
Emerging markets (EM) posted positive returns over the quarter (MS Emerging Market Index +4.0%), but lagged the MSCI World Index. The start of the year brought with it renewed optimism about EM, given the re-opening of China’s economy. Although US-China tensions resurfaced during the quarter, optimism about the re-opening of the economy and an apparent easing of regulatory pressure on the internet sector were positive for the market.
After one of the worst years in history for bonds in 2022, the bond market finished the first quarter back in positive territory on the back of a decline in yields. The US Aggregate Bond Index returned a positive 3.1% over the quarter. Longer-dated bonds posted the best fixed income gains. As markets reacted to fears of a banking crisis, government bond markets went from pricing in rate hikes to discounting sizeable rate cuts. In the aftermath of the collapse of Silicon Valley Bank, the spotlight has turned toward the creditworthiness of bond issuers, with investment-grade bonds performing well while high-yield bonds performed poorly.
Commodities gave mixed signals about the economy to investors in the first quarter of 2023. Oil futures prices sank 6% on worries about the strength of the U.S. economy. At the same time, copper prices rose during the first quarter. Copper is seen as a bellwether for the global economy, as it is a common input for equipment and products in a wide range of industries. Copper futures ended the first quarter up nearly 9%. Gold prices also rallied 8.5% over the first quarter.
Q1 2023 – Interest Rates and Inflation
Underlying the back and forth of sentiment in the stock and bond markets were significant swings in expectations for Fed policy. Investors started off the year believing that inflation pressures were coming under control, which could enable the Fed to end its interest-rate hikes by the second quarter and begin easing monetary policy by year-end.
While there were signs that hiking cycles were already biting (particularly in housing markets), the full spill-over effects to the broader economy are yet to come.
The latest consumer price index (CPI) data was mixed, as price growth eased somewhat in February and March, but still remained high. “Core” inflation, which excludes volatile food and energy prices, remained above the Fed’s comfort zone. If tight labor markets continue to boost unit labor costs, inflation in services sectors may linger for longer than investors expect.
By early March, markets were braced for the Fed taking rates higher and keeping them there longer.
However, the outlook changed practically overnight on March 9th with the collapse of Silicon Valley Bank. The crisis among regional banks sparked worries of a credit crunch that would slow economic growth, which in turn could take the pressure of the Fed to stop raising rates.
Central banks continued with their interest rate hikes, though some adjusted their stance. The Federal Reserve (Fed) announced two rate hikes in the quarter of 25bps each, marking a slowdown. The Bank of England (BoE) approved two rate hikes of 50bps and 25bps, respectively. The European Central Bank (ECB) remained more hawkish by comparison and hiked rates twice in 50bps increments. The Bank of Canada enacted a rate hike of 25bps but signalled a pause immediately upon doing so, while the Bank of Japan (BoJ) made no further adjustments to its yield curve control policy, despite core inflation rising.
It has been some time, 16 years to be precise, since we have had a federal funds rate close to 5%. The blue line in the chart below highlights how historically low the federal funds rate has been since the Great Recession. The Federal Reserve’s longer-run target for the federal funds rate is between 2.3% and 3.6%.
The question is what will the central banks do next. Market expectations are pointing towards one more rate increase before the summer and possible rate cuts in the second half of 2023. The Fed is trying to thread a needle in balancing the threats associated with the banking crisis and the need to combat still-high inflation. Fed Chair Jerome Powell made a point to say there were costs to bringing inflation down to the Fed’s 2% target, but the costs associated with allowing inflation to remain high would be more severe.
Q1 – 2023 – Charts
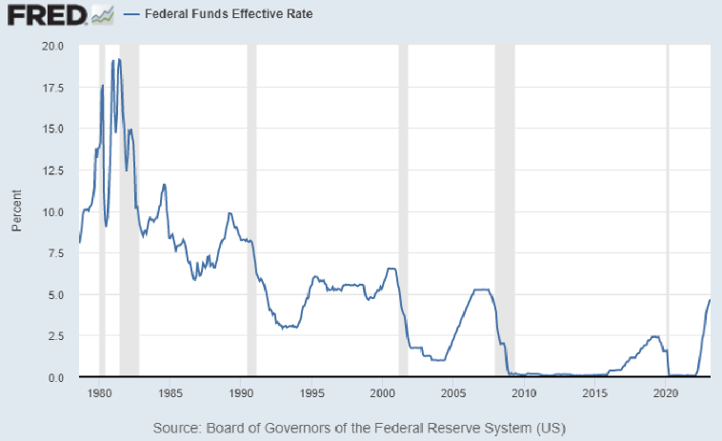
- It has been 16 years since the Federal Funds Rate has been as high as 5%
- Markets will be highly dependant on rate decisions going forward.
- Central bankers will be attempting to walk a fine line of attempting to dampen inflation with higher rates while trying to avoid undue damage to economic growth.
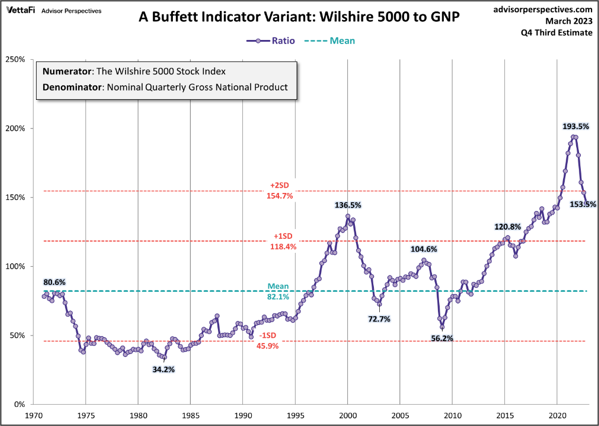
- The Wilshire 5000 Index, which is a broad-based stock index, divided by the GNP illustrates how risky the market still is relative to the last 50 years.
- This indicator of market valuation measures the market capitalization of public equities relative to Gross National Product of the United States.
- When public market valuations are high relative to GDP (100%+), as they are now, that is an indication that markets are overvalued.
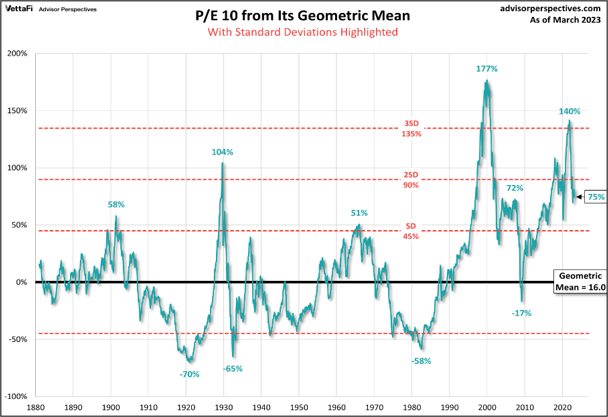
- The P/E 10 ratio divides the price of the S&P500 by a 10-year average of inflation-adjusted earnings, effectively smoothing out fluctuations in the business cycle.
- This 140-year graph showing the Price Earnings (P/E) Ratio with risk being highlighted, shows that the market is still priced rather expensively. Stock prices would need to come down relatively more than earnings to bring this metric back to lower historical averages.
- When the ratio exceeds 2 standard deviations above the mean, bear markets have historically followed. As the metric recently breached 3 standard deviations from the mean level, it is no surprise that US equities have had significant drawdowns.
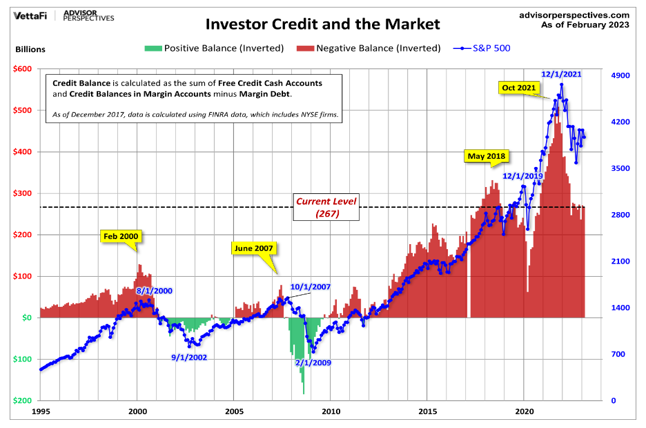
- Investor credit balances and margin debt overlayed with S&P 500 performance over the last 28 years. Investors have historically negative credit balances with the market at new highs.
- As markets fall, there is widespread selling of securities causing margin balances to turn positive since investors are required by their brokers to reduce their debt balances, often more than mitigating it.
- Preceding major recessions such as the Tech Bubble (2000), the Financial Crisis (2007-2008), margin levels tend to peak with the market – making it a useful indicator to watch for future downturns.
Chart 1: Ten Year U.S. Treasury Yield (%)
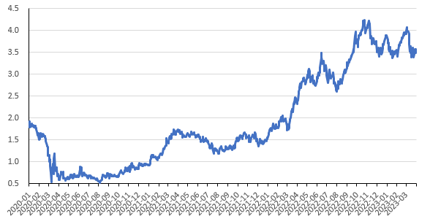
Table 1: Commodities (USD)
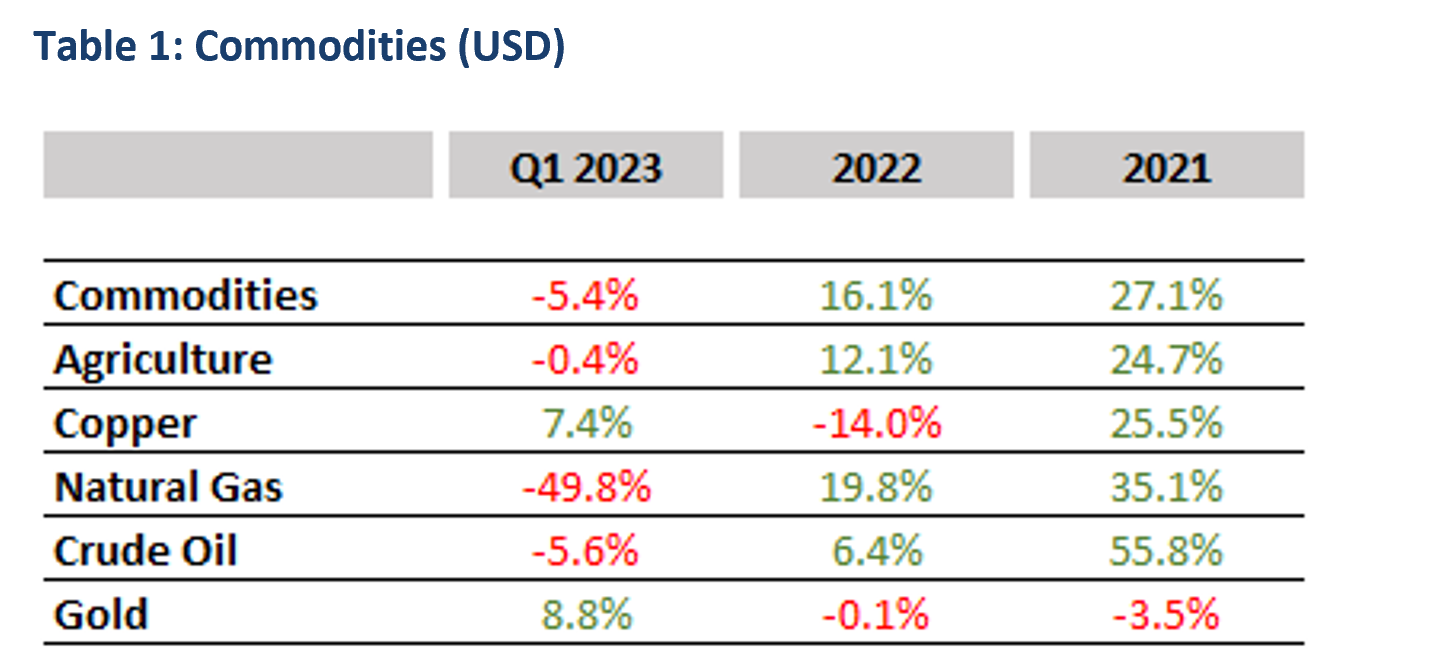
Chart 2: Cdn & U.S. Bond Market Performance
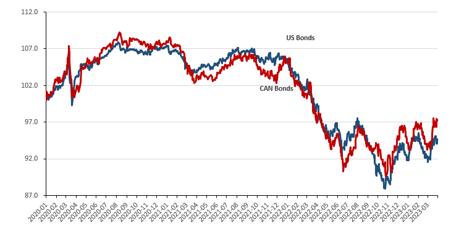
Table 2: Summary of Global Equity Returns
Download a copy of this article in pdf here.
Insights
View AllNews & Events

News & Events
Keep up to date on Our Family Office's latest firm news, events, global and regional awards, as well as the latest announcements.
Tim Cestnick’s Globe & Mail Articles

Tim Cestnick's Globe & Mail Articles
Catch up on our Co-Founder and CEO, Tim Cestnick's weekly column. His status as an expert is reinforced by his role as a tax and personal finance columnist for The Globe and Mail, Canada’s most prominent national newspaper.
Investment Thinking

Investment Management
We provide tax-efficient preservation and growth of your investment assets, utilizing best-in-class global strategies, strategic asset allocation, rigorous due diligence on managers and their selection.
Podcasts

Podcasts
Our Family Office proudly presents the Our Family Office Podcast. Throughout the inaugural season, host Adam Fisch speaks to various experts from across our firm, offering insights into the areas of focus for an integrated family office, and the ways that a Shared Family Office™ can help Canada’s wealthiest families.