Investment Commentary and Tariffs Update – Q1 2025

Where Do We Go From Here?
Q1 2025 – Commentary and Tariff Update
The headline title of our previous year in review commentary dated January 29th 2025 was “Greater Certainty of Uncertainty”. Unfortunately, the amount of uncertainty has only increased since that writing with the beginning of this tariff war.
Nobody knows how the current situation will play out but historically, times of mass tariff implementation have had painful results. The Tariff of 1828 was introduced to protect Northern U.S. industries by taxing imported goods. While the protectionist policy protected some Northern manufacturers, it significantly hurt the Southern economy and set the stage for the Civil War. Then in 1930 the Smoot-Hawley Tariff Act raised tariffs on over 20,000 imported goods to record high levels despite opposition from economists. Other countries including Canada, France and Britain retaliated with their own tariffs ultimately leading to a global trade war. What started as a protectionist policy aimed at protecting American industry ended up leading to increased unemployment, decreased GDP and a worsening of The Great Depression. The saying – history doesn’t repeat but it often rhymes – is as relevant today as ever.
It is unfortunate that one man can do these things and people around the world will be negatively affected. Where is Congress? Where is the Senate? Where are the smart people that a president is supposed to surround himself with?
Everything, and I mean everything, has been getting worse since the day Trump was elected. In terms of the stock market, even before he officially announced tariffs on April 2nd the S&P 500 was down 4% year to date. Now, of course, the rout is really just beginning and the market is down nearly 16% as of this writing.
In these highly uncertain times, nobody knows what will happen next, but in order to protect your assets you should be prepared for the following: In the short-term (6-12 months), increased market volatility, higher inflation and reduced business spending activity. In the long-term, slower global growth, lower employment, layoffs and decreased consumer spending. Depending on the makeup of your assets, this preparation could mean very different things. One commonality that is for certain and has been clearly shown in recent weeks is that owning lots of stocks and relying on geographic diversification is not sufficient when the market shocks are global.
Investors have short memories. When the market is strong, they want as much stock exposure as possible. When downturns come, they run for the exits. Needless to say, buying high and selling low is not a winning formula. It is in these moments that professional advice is most valuable, guiding families toward rational decisions that maximize the likelihood of meeting their financial goals.
Many people who have most of their assets in stocks are rationalizing and justifying their position saying, “I’m a long-term investor, I’ll just hold on and wait it out.” When the market goes down 20% and you find yourself in a bear market people who own a lot of equities tell themselves, “perhaps I should’ve sold a little when the market was down 10% or even before the market went down, but these are quality companies that I own and I’m a very long-term investor, they will come back.” When the stock market is down 30%, and that has happened twice in the last five years, even though those drawdowns were short-lived, people start to think, “maybe I shouldn’t own as many stocks, and I think I will sell some.”
Sir John Templeton taught me the best time to buy is when you see capitulation in the stock market that occurs when people say to themselves, “I’m an idiot, I will never own stocks again”, and they sell almost all of their stocks. As contrarian investors we believe it is in these times when seemingly everyone is selling that you should be a buyer of stocks. We saw it in 2000 when the dot-com bubble burst and there was a bear market for two years. We saw it again in 2008 and have not seen it since as we’ve been in one of the longest bull markets in history. There is an old adage in the world of stocks that when your barber tells you to buy a stock its time to sell. In the 1920s it was the shoeshine man who was promoting stocks, the smart money was selling.
I don’t know if there will be capitulation but right now there are so many other strategies to invest in with much better risk reward characteristics than stocks.
We’re very happy to get 8% to 10% in other asset classes and we remain light in equities and will remain so until there is a compelling reason to buy. Sir John Templeton also taught me that you should be happy to pay more once you know more. We’d rather be patient and pay a little more to know the market has bottomed rather than try to pick the bottom and, as the saying goes, catch a falling knife.
We are fortunate that the All-Weather Portfolios we build at Our Family Office are designed to protect capital in volatile times like these and we are watching them do exactly that. It is not a magic formula that allows our portfolios to weather the storm but a philosophy of always looking at potential return hand in hand with the risk taken to achieve that return. This analysis leads us to have a wide-ranging diversification across many asset classes, beyond just stocks and bonds, and to seek out investments that produce returns regardless of what global markets are doing. This “risk first” mindset has left our portfolios in a secure position where we are able to be patient and maintain the flexibility to buy stocks on our timeline when we believe the return they offer is commensurate to the risk we take by owning them. This is an approach we feel not only offers superior risk adjusted returns over the long run but also produces the added benefit of a better night’s sleep in periods of market stress.
Q1 2025 – The Markets
After two years of relatively smooth sailing and blockbuster returns for stocks, the first quarter of 2025 was a rude awakening. Stocks went into the start of 2025 with the bull market intact, albeit with valuations looking stretched. That backdrop began to change as signs of a trade war emerged. The first quarter of 2025 didn’t quite turn out as many investors thought it would, with the Trump administration’s trade war upending the rosy outlook for the economy.
After the stock market hit record highs to start the year, news that China’s DeepSeek had developed an artificial intelligence (AI) model comparable to market leaders, but at a fraction of the cost, caused investors to reassess expectations around AI, US leadership in the field, and returns on investment.
Tariffs were a key theme of the quarter that spooked investors and dimmed the outlook. Shifting expectations around the severity of pending tariff announcements due on April 2nd drove swings in market sentiment. In late February, growth stocks were rolling over and the hottest stocks of 2024 were falling fast. By the end of the first quarter, the S&P 500 index slid 10% from February’s peak into correction territory.
US stock markets ended the quarter in negative territory with the S&P 500 index down 4.3% (in US dollar terms). A notable dispersion and a shift in market leadership occurred.
Among the 11 major sectors, the worst losses came from consumer discretionary which plunged 13% in the first quarter. The technology sector ended the quarter down 12%, dragging the index lower after dominating the market for the better part of the last two years. Chip giant Nvidia saw losses of more than 19%, while Tesla plunged more than 35%.
Excluding the “Magnificent 7”, the S&P 500 index remained relatively flat amidst uncertainty. Value stocks, which had been left in the dust by the big rally in tech, rose during the first quarter, with gains among dividend stocks, consumer discretionary, and healthcare names. The best performance came from energy stocks, which gained 10% in the first quarter. Healthcare stocks also fared relatively well, rising 6.5%.
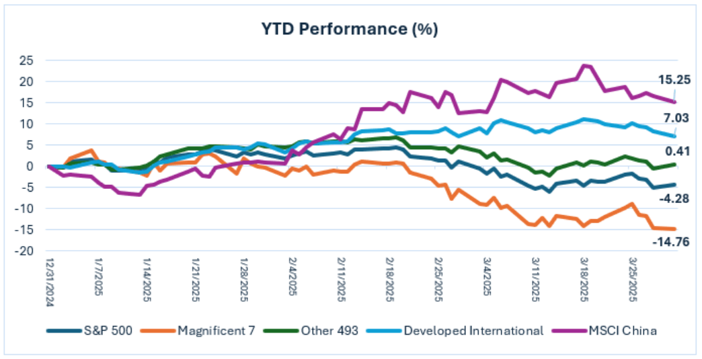
As US technology stocks lost ground in the quarter, international markets surged amid a global shift. Chinese markets gained 15%, while eurozone markets rose 12%, thanks in part to major fiscal initiatives designed to stimulate growth and enhance the region’s defense capabilities. Canadian markets also ended the first quarter in the green.
The bond market remained mostly in positive territory as equities sold off. Bond yields dropped as concerns about the economy rose. Yields on the 10-year U.S. Treasury note dropped to 4.23% at the end of the quarter after peaking at 4.79% in early January. Bond yields move in the opposite direction of prices, and as such bonds made positive gains over the quarter.
After cutting rates by a full percentage point in the fall of 2024, the Federal Reserve kept interest rates steady at its first two policy setting meetings of 2025.
The Bank of Canada remains on a more consistent path of rate cuts, cutting twice in the first quarter, the seventh consecutive cut since the summer of 2024.
In its policy meeting in March, Fed officials projected weaker growth, higher unemployment and higher inflation than they had anticipated in December. Moreover, nearly all officials judged that if their forecasts were to be proven wrong, it would be in the direction of even softer growth, more joblessness and firmer price growth.
This combination of stagnant growth and higher prices — called “stagflation”— could make it harder for the Fed to cut interest rates this year to pre-empt any slowdown.
The decisions the Fed will make in the coming quarters and the reaction of the bond markets will be extremely important. Although tariffs are currently occupying the headlines in the background there is still a massive debt problem. An expected $9 trillion in US debt is expected to mature or need refinancing in 2025 and the interest costs associated with that rollover are significant.
It is moments like this that reminds us of the importance of a well diversified portfolio with components that do not correlate with each other, protecting your wealth and serving generations in many years ahead.
Q1 2025 – Charts
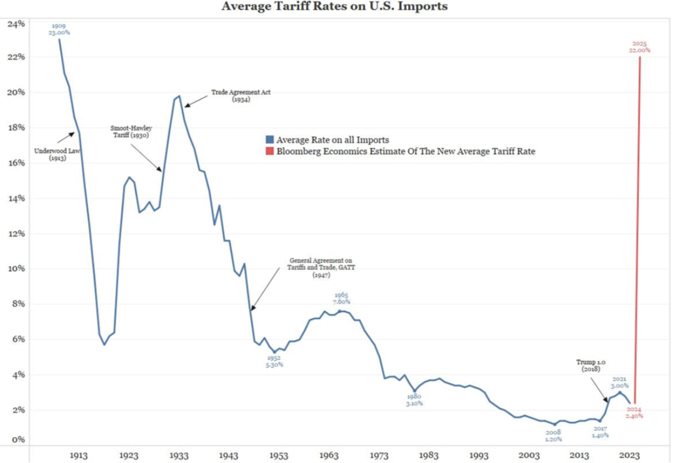
- The above chart shows the average tariff rate on U.S. imports for over 100 years.
- For historical perspective you can see the increase in tariffs during the Smoot-Hawley Tariff Act of 1930 which led to a global trade war, increased unemployment, decrease in GDP and a deepening of the Great Depression.
- The red line shows an estimate of the new average tariff rate based on the latest U.S. tariff policy.
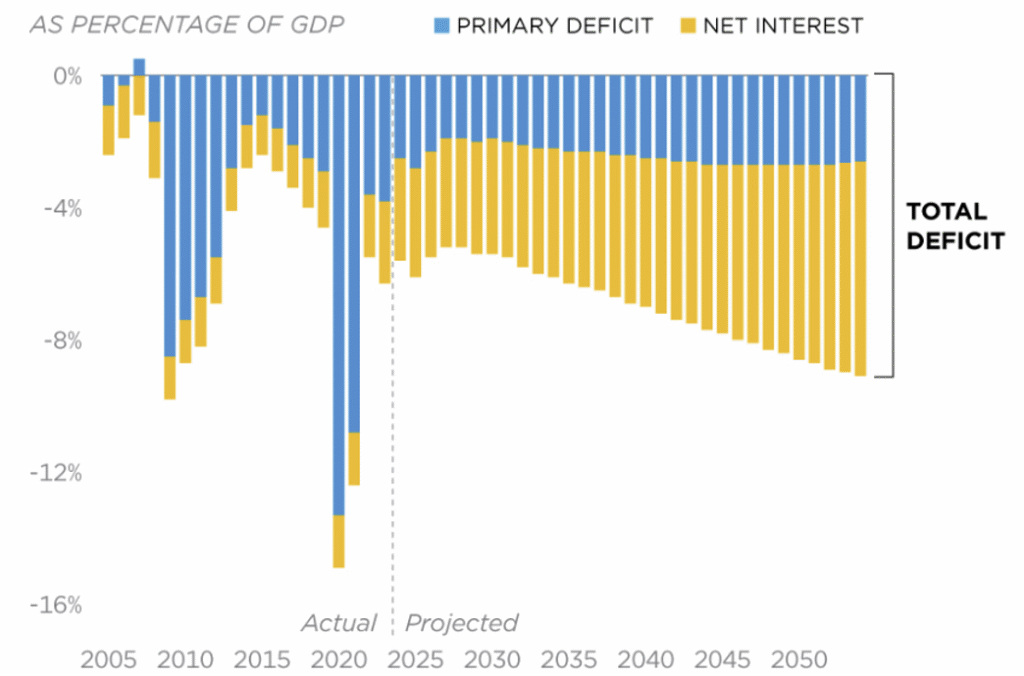
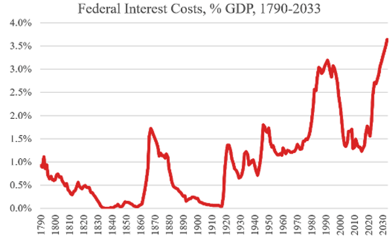
- The above chart shows the U.S. deficit (actual and projected) broken down between primary deficit and the amount that is attributable to net interest expense.
- The interest expense is set to become an increasingly large portion (eventually a majority) of the annual deficit.
- Over the coming year Fed policies and the bond market will play a crucial role in determining the rate debt is refinanced at and the magnitude of interest costs as a percent of U.S. spending.
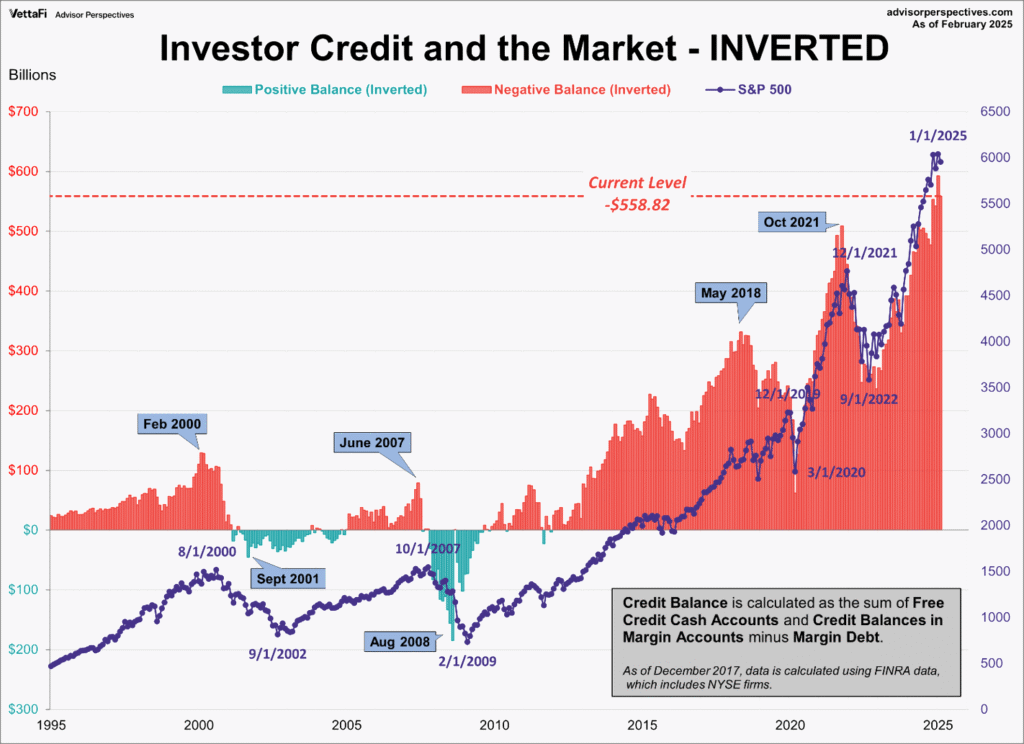
- Investor credit balances minus margin debt overlayed with S&P 500 performance over the last 30 years.
- Investors historically have negative credit balances as the market makes new highs. As markets fall there is widespread selling of securities including forced selling through margin calls, causing margin balances to turn positive.
- The Chart shows that these debt levels have peaked prior to major recessions such as the Tech Bubble (2000) and Financial Crisis (2007-2008), making it a useful indicator for future downturns.
Download a copy of this article in pdf here.
Insights
View AllNews & Events

News & Events
Keep up to date on Our Family Office's latest firm news, events, global and regional awards, as well as the latest announcements.
Tim Cestnick’s Globe & Mail Articles

Tim Cestnick's Globe & Mail Articles
Catch up on our Co-Founder and CEO, Tim Cestnick's weekly column. His status as an expert is reinforced by his role as a tax and personal finance columnist for The Globe and Mail, Canada’s most prominent national newspaper.
Investment Thinking

Investment Management
We provide tax-efficient preservation and growth of your investment assets, utilizing best-in-class global strategies, strategic asset allocation, rigorous due diligence on managers and their selection.
Podcasts

Podcasts
Our Family Office proudly presents the Our Family Office Podcast. Throughout the inaugural season, host Adam Fisch speaks to various experts from across our firm, offering insights into the areas of focus for an integrated family office, and the ways that a Shared Family Office™ can help Canada’s wealthiest families.