Investment Commentary Q3 – 2023 ‘Is Cash The King Now?’

Q3 2023 – Commentary
In writing the introduction to our quarterly investment commentary, I once in a while review previous articles written over the last few years. If you are a regular reader of our investment commentary, you would notice that we are still banging the same drum. We play offence by playing defence.
We live with the philosophy that it’s not how much you make, it’s how you keep from losing. With that said, sitting on a pile of cash today is very far from the worst thing that you could do. Earning an excess of 5.15% return in Canadian dollars and 5.5% in US dollars with daily liquidity, one can almost get excited about that. Especially if it is held in a registered account, where the return is after tax. Cash is the safest asset class, but in recent history you were never paid to sit on cash. Today, however, it’s much different. Just two years ago we earned 0.60% on cash and today it’s nearly 10 times higher for no more risk. We are very comfortable with higher levels of cash and short duration bonds, being paid over 5% in cash, and having a duration under three years and earning 7% in high quality fixed income. Our non-traditional income strategies such as mortgages, senior private credit and lending are giving 7-9%, high single digit returns with very little volatility.
Why am I saying all of this? Simply put, you do not have to take much risk (volatility) to get good returns. Why we think cash is king or queen is because it gives you the optionality to be patient now while remaining flexible to invest in other asset classes when it pays to take on the additional risk.
One should understand our simple investment ratio (SIR Ratio™) which is dividing your return by your risk. We prefer that for every unit of risk you take, you deserve one unit of return. Volatility is a number that can be used to quantify the risk of an asset class or specific investment. For example, the S&P 500 has produced annualized returns of 9.8% per year with volatility of 15.1% per year over the past 30 years. That would be a SIR Ratio™ of 0.65, or put another way, the S&P 500 gave 0.65 units of return for every unit of risk taken. It’s important to know when you were receiving the appropriate return compensating for the risk that you take. The yield on cash today is exceptionally high historically and because we do believe that there will come a time over the next 12-18 months to buy equities at lower valuations, we like having the liquidity and opportunity to take advantage of such situations. What I mean by that is buying stocks when they go down, especially during a period of capitulation or panic selling and we are not there yet.

A few years ago we made a tactical short-term asset allocation call by only investing in income strategies that were both very short duration and floating rate. Because interest rates were near zero, and we felt they could only move in one direction, we wanted to make sure that our clients could benefit as interest rates went up. Our income portfolios are very short duration, which ensured that they would protect capital when interest rates went up.
In traditional bonds our low duration holdings dramatically outperformed, being down some 3.5% when the global bond market was down 16.3%. The returns on our non-traditional floating rate income strategies, such as private mortgages, returned 5.8% in 2020, 6.5% in 2021, 7.7% in 2022 and could be 9% this year.
The world today is full of many risks. In the last quarter geopolitical risks have increased, especially in this past month. There’s no predicting when the world will be a more peaceful and safer place, and one should realize that it probably gets worse before it gets better.
Then there’s the debt crisis, yes, crisis. The United States currently sits owing over $33 trillion which is nearly $100,000 per American. The United States spends almost $2 billion on interest daily, that’s $1.4 million per minute on interest alone. Just think of where those funds could otherwise go. Canada has over $2 trillion of total debt and that represents about $56,000 per Canadian. The United States has a debt to GDP ratio of 129% compared to Canada which has a debt to GDP ratio of 107%.
Why am I bringing this up? If the United States and Canada were stocks we wouldn’t necessarily be investing in them today. I won’t spend time talking about politics, but both countries better get their act together and very quickly. The United States is losing its lustre as the leader of the free world, and with the BRIC nations wanting to reduce the US dollar’s influence on world trade, the future is unclear.
There was a time, until recently, when all the rewards went to people who took on significant debt, whether to build businesses, obtain mortgages for their homes or to lever up their investment returns. They have been the winners where the renters and savers were the losers. It is possible to see that in the future these two roles will begin to be reversed. Only time will tell.
The families we represent have been protected from much of this turmoil over the last several years and that is our job: to serve them well by building long term all-weather portfolios designed not only earn strong risk adjusted returns but reduce volatility and protect capital along the way. I’ve been known to say that we serve very demanding clients. When the market is up, they want to be up and when the market is down, they want to be up. Through prudent asset allocation we have been able to accomplish this in our client portfolios over the past several years and look forward to continuing that trend for many years to come.
Q3 2023 – The Markets
Investors entered the quarter optimistic that the Federal Reserve had orchestrated a soft landing for the economy, and that the era of tightening policy rates would soon end. The market hit what has turned out to be 2023′s high point so far on July 31. That enthusiasm withered over August and September, however, as the prospect of rates staying “higher for longer” sank in. Rising interest rates, fears of a rebound in inflation and concerns about a future economic slowdown weighed on the major indices in August and September. Equity markets finished the third quarter with a modest loss.
Even as decades-high inflation showed meaningful signs of slowing, global central banks indicated their resolve to keep interest rates higher for longer. The Fed raised its benchmark federal-funds effective rate an additional 0.25 percentage points in July to a target range of 5.25%-5.50%, then held rates steady for two consecutive meetings.
While the overall market ended the third quarter not far from where it started, there was a wide disparity between equity sectors. This quarter saw an apparent change in sentiment as big tech stocks lost steam. Most of the so-called “Magnificent Seven” – Apple, Microsoft, Alphabet, Amazon, Tesla, Nvidia and Meta – declined, weighing on the overall market. The same stocks that kicked off what many called a new bull market were the ones that subsequently took the market lower. So far this year, this group of mega-sized technology companies are dominating the performance of the index.
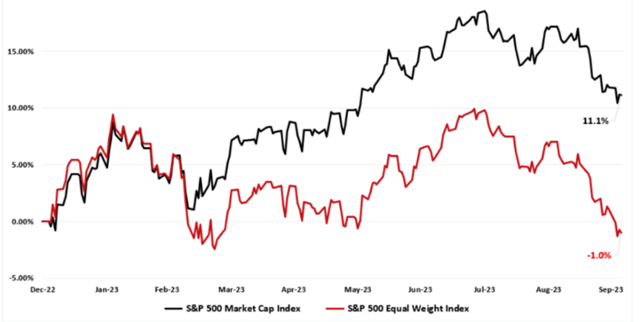
Since 2023 began, the S&P 500 index, weighted by market capitalization (meaning larger companies have heavier impacts on the index), has returned 11.1%. Over the same period, an equal-weight version of the index, which gives the same slot to each company regardless of size, has lost 1%. The level of concentration brings more inherent risks in the stock market. The reversal seen this year is remarkable and a reminder to investors that prudent portfolio construction is always important to mitigate market volatility.
Energy stocks were the quarter’s biggest winners, thanks to rising oil prices. Oil rose throughout the quarter on continued supply concerns as Saudi Arabia and Russia extended voluntary supply cuts to the end of the year. At the other end of the spectrum, real estate stocks crumbled on fears of a slowdown in the housing market.
S&P 500 Market Cap vs. Equal Weight Returns
As yields rose to their highest levels since 2007, short-term bonds kept afloat during the third quarter, while the rest of the bond market (especially long-term bonds) took a hit. Long-term bonds—those due in 10 years or more, whose longer durations make them the most sensitive to interest rates—were hit hardest. It’s been a continued bumpy ride in the bond market thanks to shifting expectations about Fed policy, and the central bank’s hawkish stance. Even during the secular US bond bull market of 1982-2021, cyclical bear markets ended only after an eruption of financial turmoil. It would be unusual if this current bond yield ascent ends without significant casualties in the global economy or the financial system.
When short-term Treasury yields exceed long-term yields, it’s known as an inverted yield curve. It’s a sign of investor pessimism about the economy and is widely seen as a precursor to a recession. (Not all yield curve inversions lead to recessions, but historically all recessions have been preceded by an inversion of the yield curve.) As yields across the spectrum of U.S. Treasuries rose over the third quarter, the yield curve remained inverted for the sixth quarter in a row, although it’s less steep than it was a few months ago. The length of the yield curve inversion (rather than magnitude) is positively correlated with the length of the recession that followed it, suggesting that we may be in for a more drawn out recession.
An inverted yield curve with rising real yields has implications for the economy. It creates a disincentive for banks to lend. With positive real yields, bonds and cash are now offering a compelling, less-risky alternative to the stock market.
The Yield Curve Remains Inverted
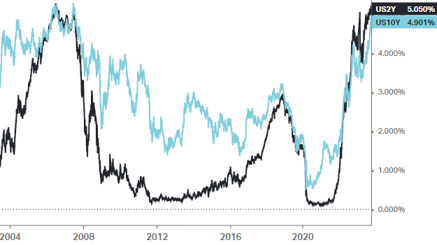
The above chart shows the yield on both the 2-year US Treasury and the 10-year US Treasury. The curve remains inverted as the yield on the 2-year is still higher than the longer dated 10-yr yield.
Q3 – 2023 – Charts
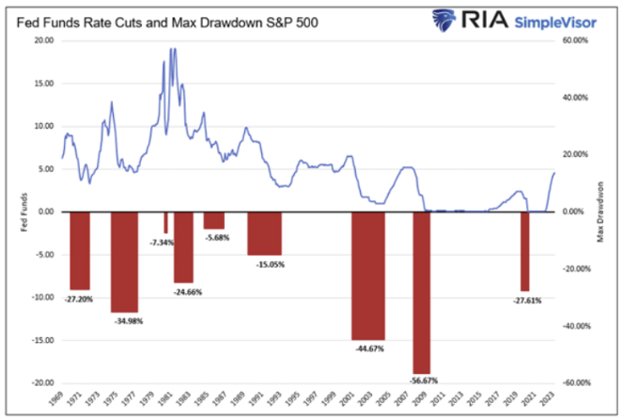
- The above chart shows a history of the Fed Funds rate (top) along with maximum drawdowns in the S&P 500 index (bottom).
- Large drawdowns in the S&P 500 index often coincide with falling interest rates.
- Although lower rates may be bullish for equities over a longer horizon, a crisis and market panic is often the initial catalyst for central banks to begin dropping rates aggressively.
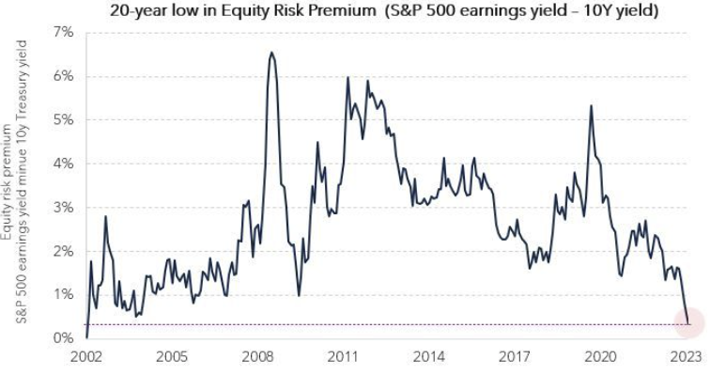
- The above chart shows the equity risk premium (as measured by the difference between the S&P 500 earnings yield and the yield on 10-year Treasuries).
- This metric depicts how much additional return may be expected from taking the extra risk associated with holding equities vs. holding a risk-free treasury.
- Important to note is that the risk premium for equities is now very near 0%. In other words, in the current environment investors receive almost no additional compensation for taking the additional risk of holding equities.
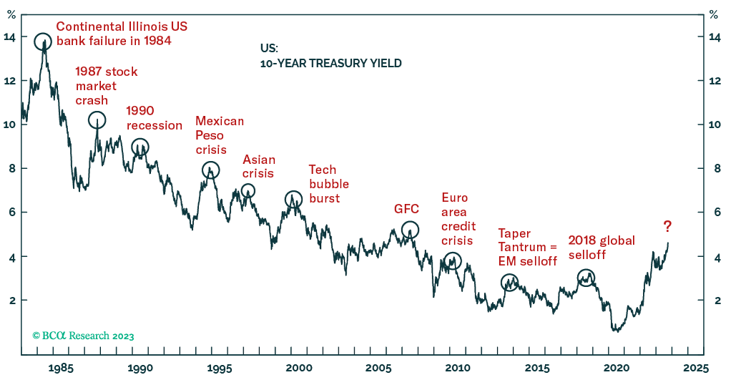
- The above chart shows the 10-year Treasury yield with significant market volatility events highlighted.
- The Fed will likely maintain its hawkish bias until US financial conditions substantially tighten to herald a considerable growth slowdown.
- Peaks in the 10-year yield have coincided with periods of market turmoil and if history is any indication a material drawdown in global risk assets may be likely as yields peak in the current cycle.
Chart 1: Ten Year U.S. Treasury Yield (%)
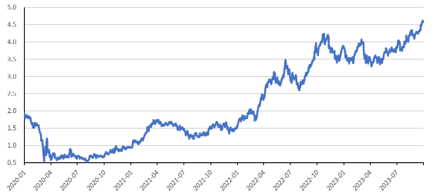
Table 1: Commodities (USD)
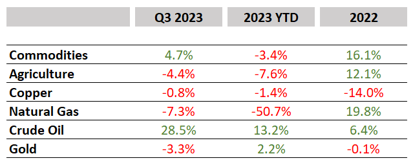
Chart 2: Cdn & U.S. Bond Market Performance
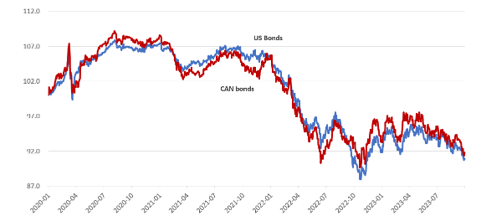
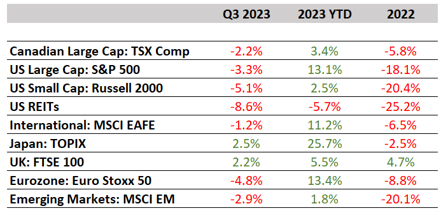
Table 2: Summary of Global Equity Returns
Download a copy of this article in pdf here.
Insights
View AllNews & Events

News & Events
Keep up to date on Our Family Office's latest firm news, events, global and regional awards, as well as the latest announcements.
Tim Cestnick’s Globe & Mail Articles

Tim Cestnick's Globe & Mail Articles
Catch up on our Co-Founder and CEO, Tim Cestnick's weekly column. His status as an expert is reinforced by his role as a tax and personal finance columnist for The Globe and Mail, Canada’s most prominent national newspaper.
Investment Thinking

Investment Management
We provide tax-efficient preservation and growth of your investment assets, utilizing best-in-class global strategies, strategic asset allocation, rigorous due diligence on managers and their selection.
Podcasts

Podcasts
Our Family Office proudly presents the Our Family Office Podcast. Throughout the inaugural season, host Adam Fisch speaks to various experts from across our firm, offering insights into the areas of focus for an integrated family office, and the ways that a Shared Family Office™ can help Canada’s wealthiest families.