

A year to forget, and a year to remember.
Historic is the only word we can think of to describe the stock and bond markets in 2022. The S&P 500 was down 19.4%, NASDAQ was down 33% and the Toronto stock exchange was down 5.8%. global stocks and bonds lost more than $30 trillion, which is the heaviest loss since the global financial crisis of 2008.
Not surprisingly global bonds sold off dramatically as well with the US bond market down 13% the biggest annual loss since 1999, and Canadian bonds were down 11.7%. There was no place to hide in 2022 other than energy, as oil started off the year at $79 per barrel and ended up at $80 reaching a high of $122 in March coinciding with Russia’s invasion of Ukraine. The very popular 60/40 model asset allocation was down 15.8% its worst year since 2008, when it was down 20.1%
2022: An Outlier Year for Stock and Bond Returns
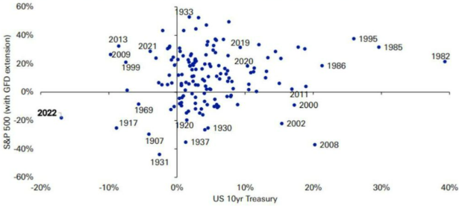
Source: Deutsche Bank. Annual total return of S&P 500 and US 10yr Treasury since 1872
One should be prepared for higher than historical levels of volatility. The trend towards increased market share of passive investing isn’t likely to reverse because the evidence favoring it as a winner’s game is overwhelming. Several studies have examined these changing market dynamics and their potential implications for investors. As ever more funds are being managed passively to an index, individual stocks are increasingly moving up and down together with less regard for specific sector or company fundamentals. This means that the effectiveness of diversification within the asset class of public equities is being reduced. Based on this we believe that, for the purposes of controlling risk, it is of the upmost importance to be diversified not only within the equity portion of a portfolio, but even more importantly, to be well diversified at the highest level between several different asset classes. Said another way, to effectively protect against market risks your portfolio should hold a much wider range of assets then just stocks and bonds.
Our portfolios are well diversified at the asset class level and poised to take advantage of market volatility, which is our intention over the coming year. While the stock market is down dramatically, price to earnings ratios (P/Es) are still not fully reflecting the increase in interest rates and the potential decline in economic growth. Although most companies are moving quickly to layoff employees, taking one-time charges of billions of dollars to reduce their overhead, we have yet to see what a reduction of the earnings (the E of price-earnings ratios) has on valuations. That is a risk that we believe we will see come to fruition in 2023.
2022 started the year off with inflation in the US at 7%, the highest in 40 years. It continued around that level peaking at 9.1% in the month of June. Because of the response of The Federal Reserve, the Bank of Canada, and most central banks around the world, raising interest rates quickly and dramatically, inflation moderated in the second half of the year ending 2022 at 6.5%. Those interest rate policies are having an impact, with inflation has started to abate and the rate of inflation slowing down. The analogy of your foot on a car’s gas pedal works, as inflation lessens central banks will now begin to coast, waiting to gauge the results of the rapid and dramatic increases that have taken place.
There are more forecasters with more opinions than ever, all trying to predict what the future holds. Will there be a recession? Will we have a soft landing or hard landing? The one thing we know is that the pendulum always swings too far in both directions markets.
In the case of interest rates, when interest rates are zero, they can only move in one direction and that’s up. They were low and were forced even lower during the global pandemic as governments and central banks feared the unknown and how devastating the economic effects would be. Interest rates stayed too low for too long and that was in itself inflationary. It was exasperated by The Federal Reserve‘s view that inflation was transitory.
Well, we now know it is not transitory, hence our belief that it will take a number of years for inflation to get back to the target 2% which means that interest rates are likely to stay high for longer. They were way behind the curve on this one and now they’re trying to make up ground, which we believe will potentially cause serious harm to economies around the world. The impact of such a dramatic increase in interest rates could possibly be felt for several years. The original causes of inflation in 2021 were geo-political events, supply chain issues, oil prices, and the sudden burst of spending after widespread Covid lockdowns. We believe that the next concern regarding inflation, not appearing yet, will be the increased cost of labour in an already tight market.
Strategic asset allocation is a 5 to 10 year investment plan to grow and preserve one’s capital. Tactical asset allocation is a 1 to 2 year investment decision that will enhance or protect your investment portfolio. We continue to stand by our tactical call of 18 months ago, where all income strategies were floating rate debt or very short duration. We will not alter this strategy until we believe that interest rates have peaked, in which case we will lengthen the duration of our fixed income portfolios. We are also underweighted in the stock market looking for buying opportunities, which we believe will be presented to us in 2023 and perhaps even through 2024.
One year ago when we were reviewing 2021, we did not believe that it was possible for the world to be a more dangerous place. What 2022 has shown us is that it is not getting any safer. The war in Ukraine continues, thousands of lives have been lost and hundreds of thousands of civilians have been displaced. There is yet to be a real opportunity for a cease-fire, let along peace, as the war continues to escalate with Russia it seems now fighting against all of NATO. Relations between China and the United States have yet to begin to thaw. It also seems that an increasing number of countries every year are becoming more polarized and the gap between the rich and poor continues to widen. None of these facts are good for financial markets. We believe if there are any surprises at all, they will be negative ones.
It is also interesting to note that even the Doomsday Clock, which every year gets reset in January is now 90 seconds to midnight, making it the most perilous moment the world has faced since the inception of the metric. For those readers who are not familiar with the Doomsday Clock, it was started in 1947 by a group of atomic scientists. It is a symbol that represents the likelihood of a man-made global catastrophe, a metaphor for threats to humanity.
We maintain our position in our clients’ portfolios that the best way of playing offence right now is playing defence. In our opinion, the stock market is yet to be reasonably priced, but the bond market is starting to look more interesting. Remembering our investment philosophy and staying disciplined to it is why all of our clients preserved their wealth in 2022. We constantly remind ourselves that it’s not how much you make, it’s all about not losing.
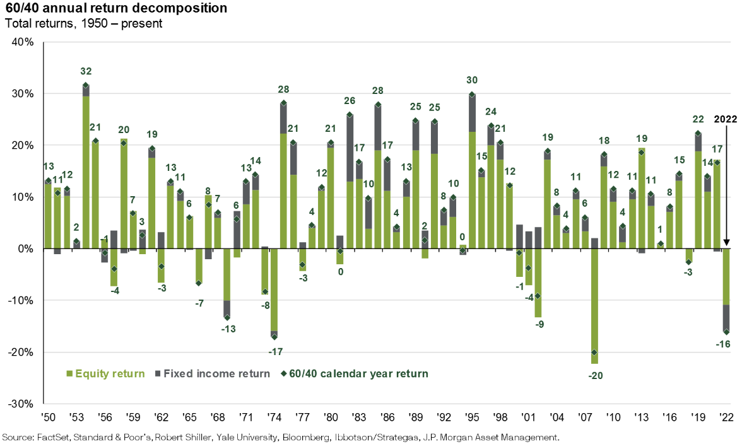
- The 60% stock 40% bond portfolio is one of the most prevalent asset allocations in the investment industry
- 2022 saw the worst year of performance for a 60/40 model (down 15.8%) since 2008 when it was down 20%
- 2022 was also unique in that both stocks and bonds were down simultaneously, which although it is not the first instance, is a rare occurrence historically
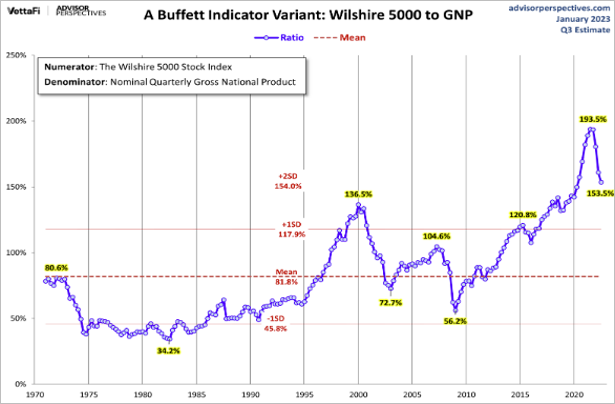
- The Wilshire 5000 Index, which is a broad-based stock index, divided by the GNP illustrates how risky the market still is relative to the last 50 years.
- This indicator of market valuation measures the market capitalization of public equities relative to Gross National Product in the United States.
- When public market valuations are high relative to GNP (100%+), as they are now, that is an indication that markets are overvalued.
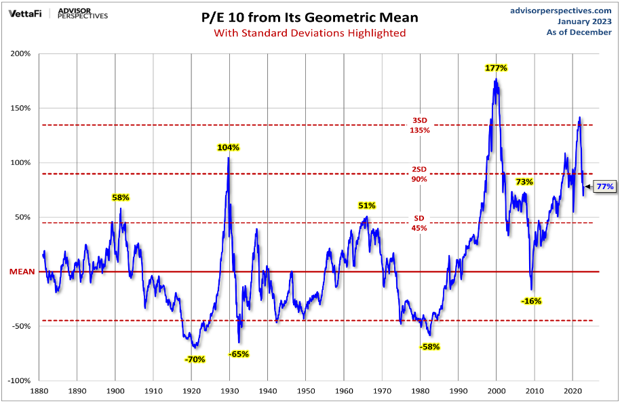
- The P/E 10 ratio divides the price of the S&P500 by a 10-year average of inflation-adjusted earnings, effectively smoothing out fluctuations in the business cycle.
- This 140-year graph showing the Price Earnings (P/E) Ratio with risk being highlighted, shows that the market is still priced rather expensively.
- When the ratio exceeds 2 standard deviations above the mean, bear markets have historically followed. As the metric recently breached 3 standard deviations from the mean level, it is no surprise that US equities were in and out of bear market territory during 2022.
Chart 1: Ten Year U.S. Treasury Yield (%)
Table 1: Commodities (USD)

Chart 2: Cdn & U.S. Bond Market Performance

Table 2: Summary of Global Equity Returns

Download a copy of this article in pdf : Click here
North American Wealth Award Nominations 2020:
Finalist in 3 Categories
What do I want to share with my heirs about my values and life experiences while I still can?
What do other successful families do about educating future generations?
What would happen to my family and business if I were suddenly gone tomorrow?
Is it possible that there might be other tax ideas we haven’t considered yet?
Who will make the important decisions and coordinate things after I’m gone?
Do I wonder sometimes if our planning done in the past is still relevant?
Are my investments properly compensating me for the risk I’m taking?
Which of my investments or accounts are no longer serving their intended purpose?
What do I expect market returns to look like in the next five years?
What is my Strategic Asset Allocation?